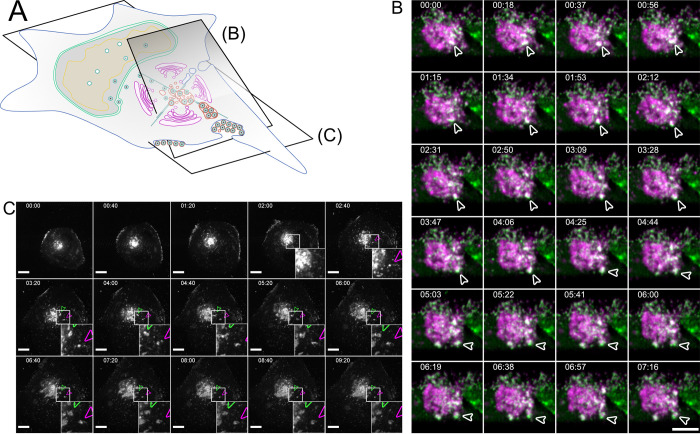
Fig 3. Bulk release from MViBs leads to EVA formation.
3A Overview indicates the subfigures’ positions in relation to the whole cell. 3B HFF cells were infected with HCMV-pp150-EGFP-gM-mCherry at an MOI of 1. At 96 hpi, the cells were imaged by lattice light-sheet microscopy, taking whole-cell volumes every 2.11 seconds at a 30° angle to the growth substrate. Maximum projections of 20 slices with a total depth of 2 μm of an area under the viral AC and incorporating the plasma membrane are shown. White arrowheads highlight an MViB positive for pp150-EGFP (green) and gM-mCherry (magenta) that approaches the plasma membrane and fuses with it. Also, refer to Supplementary Video 5 in https://doi.org/10.5281/zenodo.6611135 for a rendering and several side views. 3C HFF cells were infected with HCMV-pp150-SNAP-gM-mScarlet-I at an MOI of 1. At 72 hpi, cells were imaged live with confocal spinning-disk microscopy. Only the gM-mScarlet-I channel is shown. Both channels can be seen in Supplementary Video 7 in https://doi.org/10.5281/zenodo.6611135. The formation of two EVAs is highlighted with white arrowheads. Scale bar indicates 10 μm. The time format is hh:mm. Also, refer to Supplementary Videos 6 and 7 in https://doi.org/10.5281/zenodo.6611135.

