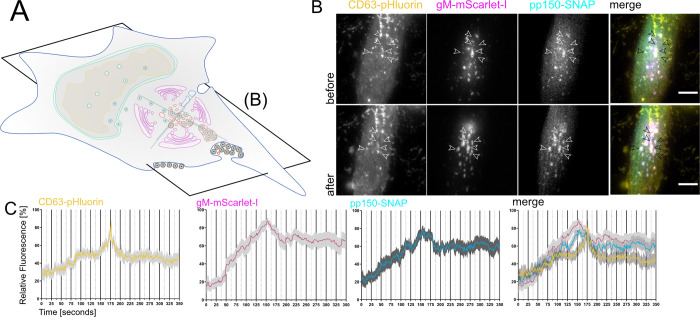
Fig 4. EVAs are the result of fusion events between MViBs and the plasma membrane.
4A Overview indicates the subfigures’ positions in relation to the whole cell. HFF-CD63-pHluorin were infected with HCMV-pp150-SNAP-gM-mScarlet-I at an MOI of 0.6 and imaged at 72 and 96 hpi by fluorescence microscopy under TIRF conditions for 1h at an average frame rate of 0.57 frames per second (fps). 4B TIRF images of a cell before (upper row labeled with before) and after (lower row of images labeled "after") bulk release events from MViBs occurred. Positions of EVA formation are marked by the white arrows (black in the merge). Scale bar indicates 10 μm. Also refer to Supplementary Video 9 in https://doi.org/10.5281/zenodo.6611135 for live-cell lattice light-sheet microscopy data showing the release of MViBs into EVAs. 4C Quantification of fluorescence signals during EVA formation events over time. The fluctuation of fluorescence intensity was measured at EVA formation sites during exocytosis events. A spike of CD63-pHluorin intensity can be seen at 100 seconds (middle of the graph). Solid lines are averages from 14 EVA formation events extracted from 5 different cells chosen from 4 replicates of infections. Grey areas show the standard error of the mean.

