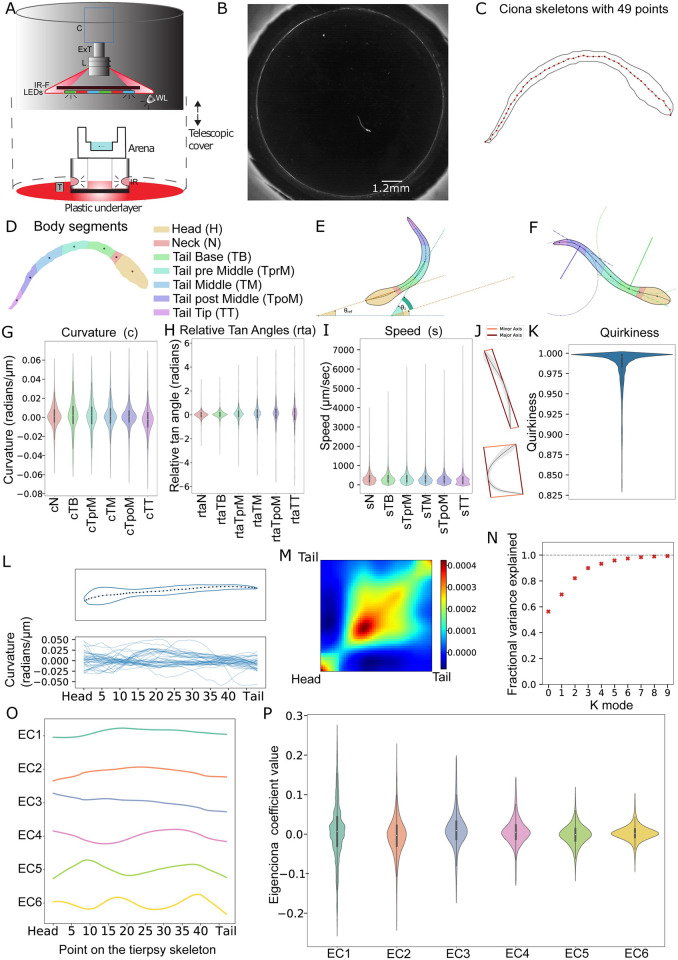
Fig 1. Characterization of C. intestinalis swimming using core features and eigencionas.
(A) Schematic of the Ciona Tracker 2.0 video acquisition setup. Each setup was composed of a monochrome camera (C), connected to an extension tube (ExT) and a magnification lens (L). A holder piece housed an IR filter (IR-F), a set of LEDs and a white light source (WL). The arena was nested in a PLA ring that housed the infrared lights used for dark field illumination (IR). A plastic underlayer secures the PLA ring and a thermometer that reports temperature for each acquisition setup. A telescopic plastic cover shields the arena from external light sources. (B) An image of the raw data (before processing with Tierpsy) showing a larva swimming in the arena. The average length of a Ciona was 1,330.61 μm or equivalently 115.10 pixels. (C) Ciona skeletons generated using Tierpsy are defined by 49 equally spaced points on their midlines. (D) Skeletons were divided into 7 body segments along the length of the animal. (E) Definition of angles: θ1 refers to the tangent angle of a particular segment, θref refers to the tangent angle for the head segment (with respect to the horizontal axis). The difference θ1-θref is defined as the relative tangent angle for each segment. (F) Curvature definition visualization. Curvature is defined as inversely proportional to the radius of the osculating circle at a given point on the skeleton. Green shows lower curvature and blue shows the centroid of a segment with a higher curvature. (G–I) Distribution of curvature, relative tangent angle, and speed values for each body segment in wild-type larvae (n = 694 larvae). (J) Quirkiness is defined as the ratio of the major and minor axes of the body as illustrated. (K) Distribution of the quirkiness for wild-type larvae (n = 694 larvae). (L) A skeleton with the contour and 49 points are shown as an example. Curvature values along the 49 points for a set of randomly sampled skeletons show variation in the skeleton postures. (M) Covariance matrix calculated from curvature values of a subset of wild-type skeletons. The smooth structure of the covariance matrix indicates that postures can be represented using a small number of eigencionas (n = 231 larvae). (N) Six eigencionas are sufficient to explain 97% of the variance in the curvature. (O) Visualization of the top 6 eigencionas obtained by an eigen decomposition of the covariance matrix, shown in descending order of the fraction of the variance explained. X-axis refers to points along the skeleton. (P) Distribution of eigencoefficient values for wild-type larvae (n = 694 larvae). For statistical analysis, we first tested for data normality using Shapiro–Wilk test (α = 0.05). To compare between different body segments, we used the Wilcoxon signed-rank test (α = 0.05) (see S3–S6 Tables for the underlying data).

