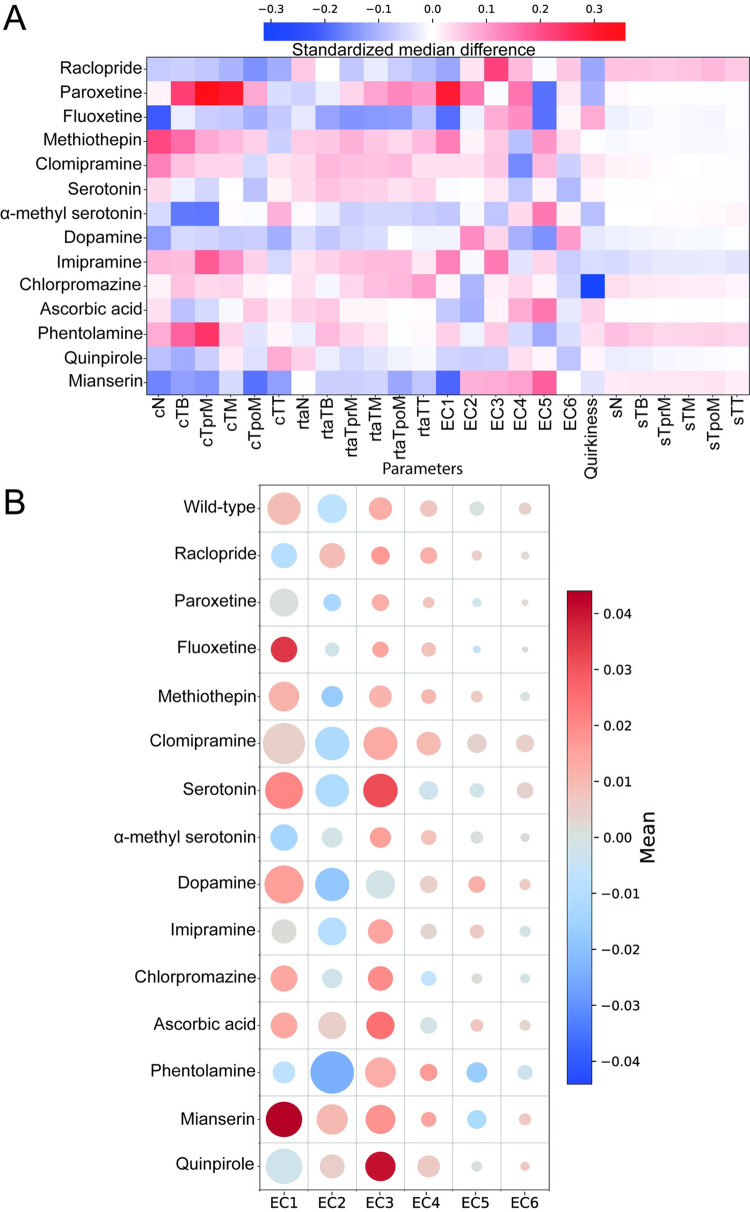
Fig 2. Behavioral barcoding reveals the diverse effects of bioamines in locomotion features.
(A) Heatmap showing SMD of 25 features, calculated for drug-treated larvae relative to wild-type larvae. Working concentrations for all drugs are shown in Table 1. Note that SMD values for dopamine are calculated relative to an ascorbic acid solution that was used as a solvent for dopamine (SMD values shown in S7 Table). (B) Bubble grid chart showing effects of drug treatments in the use of eigencionas by swimming larvae, as quantified by the eigencoefficients. Color of circles indicates the mean value of the eigencoefficient features as indicated by the colorbar, while their radius indicates the variance (please see S8 and S9 Tables and https://doi.org/10.5281/zenodo.6761771 for the underlying data). The number of animals and video frames contributing to this figure are indicated in S1 and S2 Tables. cN, curvature Neck; cTB, curvature Tail Base; cTM, curvature Tail Middle; cTpoM, curvature Tail post Middle; cTprM, curvature Tail pre Middle; cTT, curvature Tail Tip; EC1, Eigenciona 1; EC2, Eigenciona 2; EC3, Eigenciona 3; EC4, Eigenciona 4; EC5, Eigenciona 5; EC6, Eigenciona 6; rtaN, relative tan angle Neck; rtaTB, relative tan angle Tail Base; rtaTM, relative tan angle Tail Middle; rtaTpoM, relative tan angle Tail post Middle; rtaTprM, relative tan angle Tail pre Middle; rtaTT, relative tan angle Tail Tip; SMD; standardized median difference; sN, speed Neck; sTB, speed Tail Base; sTM, speed Tail Middle; sTpoM, speed Tail post Middle; sTprM, speed Tail pre Middle; sTT, speed Tail Tip.

