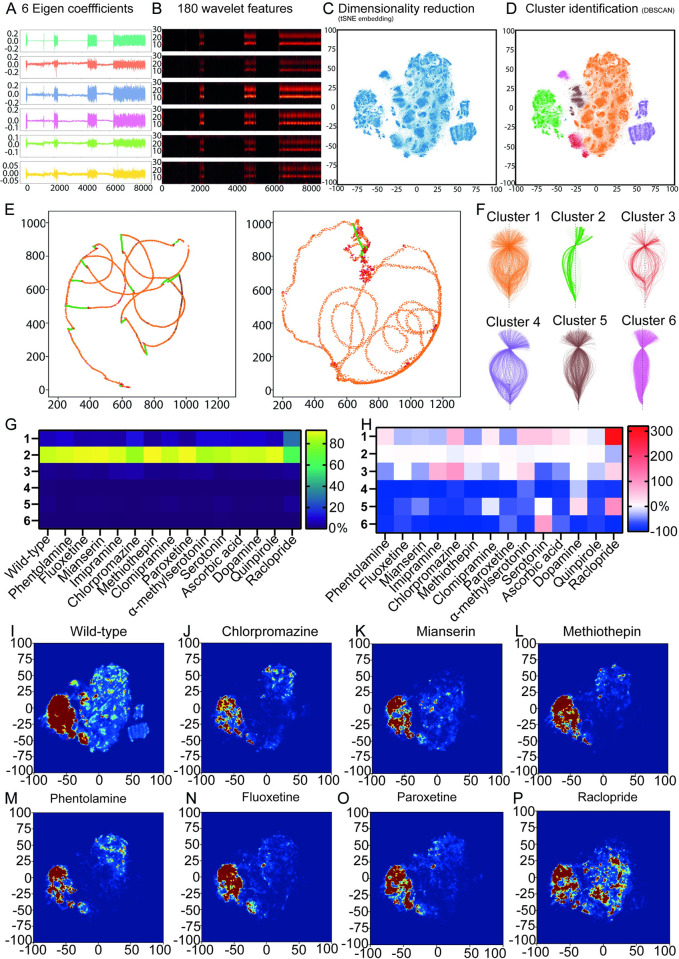
Fig 5. Spatiotemporal embedding uncovers the influence of neuromodulators on stereotyped behaviors.
(A) We used the 6 eigencoefficients we previously obtained to define a 6-dimensional input feature space. (B) We computed wavelet transforms of these features over 30 frequencies for the wild-type dataset. Wavelet transform of the 6D eigencoefficient time series of panel A shown. (C) Dimensionality reduction was applied using tSNE to embed the 180-dimensional wavelet features into a 2D space of behavior. (D) We then used the DBSCAN algorithm to cluster into regions based on their density. (E) Examples of neck point tracks for larval swimming labeled according to cluster identity. (F) Examples of skeletons aligned to the neck for each of the clusters. (G) Heatmap visualization of the effects of drug treatments on cluster usage (values in % can be found in S25 Table). (H) Heatmap representation of the percentage fold change relative to wild type for the data shown in panel (G) (values in % can be found in S26 Table). In panels G and H, dopamine values are compared relative to ascorbic acid. (I–P) 2D tSNE embedding of wild type and different drugs. The color is showing the density with which the different clusters are occupied (blue being lower and red higher). Underlying data can be obtained from https://doi.org/10.5281/zenodo.6761771.

