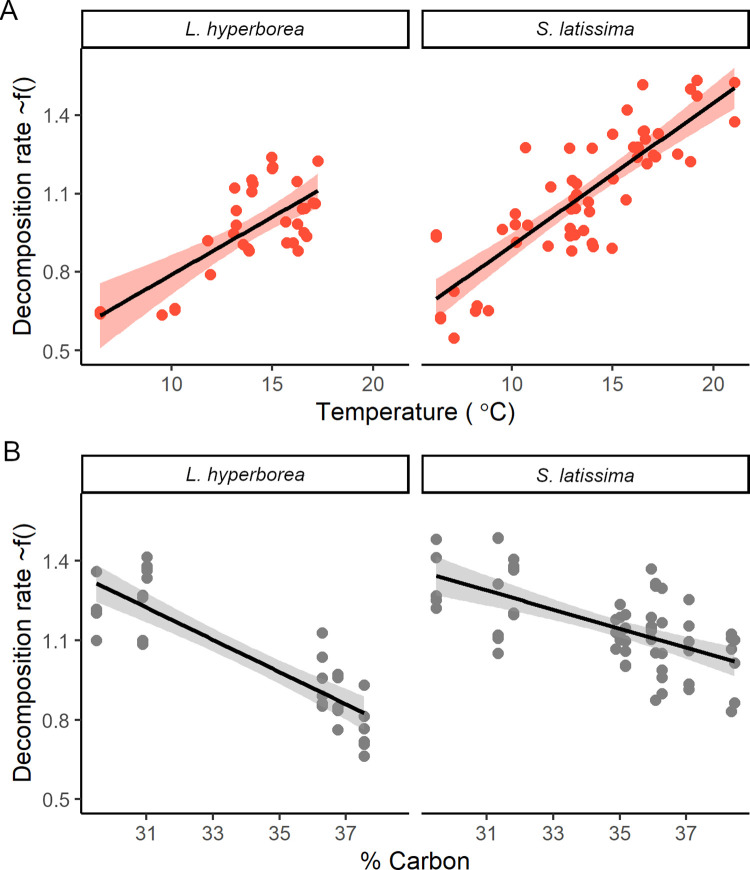
Fig 3. Relationships between decomposition rate and water temperature, carbon content, and species.
Relationships between kelp decomposition rate (% d−1) and significant predictor variables in generalized linear models: (A) average water temperature during the experiment and (B) initial % carbon content for both species, from the generalized linear mixed effect models, with all other variables in the model held fixed (Data C in S1 Data). Black lines are the expected value from the model, shaded error bar (a and c) is confidence interval, and points are partial residuals for each sampling time at each site. Plots are created with R package visreg [44].

