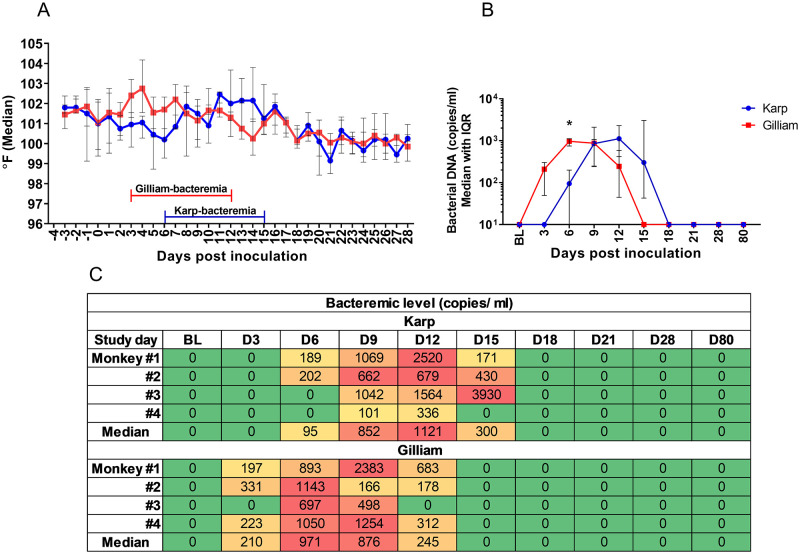
Fig 2. Daily body temperature charts ranging from 0 to 28 days post infection (dpi) following inoculation with O. tsutsugamushi strain Karp, n = 4 (red line) and Gilliam, n = 4 (blue line).
Temperatures (°F) are represented as median lines with IQR (A). The kinetics of bacteremia (B) and the heat map of individual bacteremia levels (C) for the Karp and Gilliam infected macaques between 0 to 80 dpi (median with IQR) are shown. In the bacteremia heat map of bacterial load (copies/ml), green indicates a negative PCR result, yellow 1–500 copies/ml, orange 500–1,000 copies/ml and red indicates >1,000 copies/ml. Comparison of bacteremia levels between Karp and Gilliam infected animals was performed using the Mann Whitney t-test, p value < 0.05 denoting significance (*).

