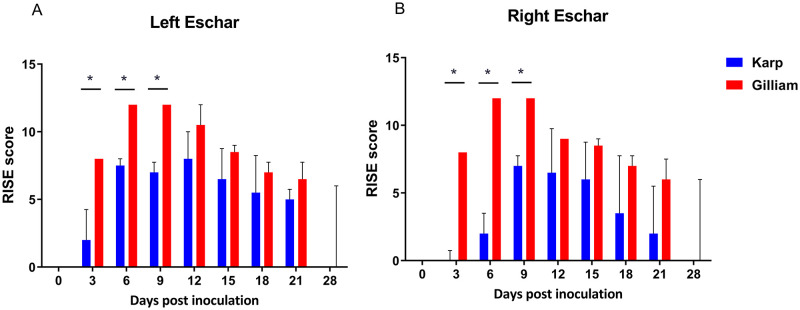
Fig 4. Time-course evaluation of eschar severity between Karp (n = 4) and Gilliam (n = 4) inoculated macaques as determined by the RISE score (maximum score = 12, score details in S2 Table).
Eschars on the left (A) and right (B) thighs showed greater severity for Gilliam-infected macaques at 3, 6, 9 dpi. A significant difference (p value < 0.05) in RISE scores is marked with an asterix (*); analyzed by Mann Whitney t-test with two-tails.

