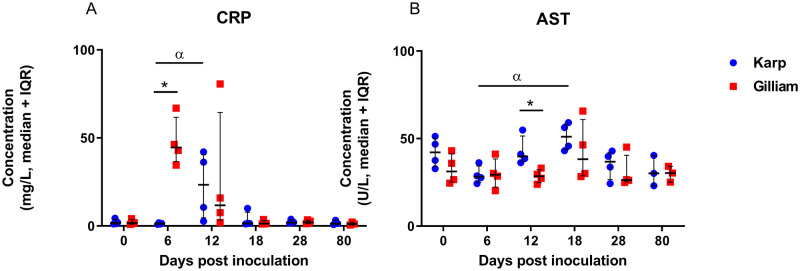
Fig 6. Scatter plots for CRP (mg/L) and AST (U/L) plasma concentrations for Karp (n = 4) and Gilliam (n = 4) infected macaques.
Time-course data from 0 to 80 dpi, statistically significant differences at specific time points are indicated with an asterisk (p value <0.05, Mann Whitney t-test), and with α for differences between time points (p< 0.05, Kruskal-Wallis ANOVA test with Dunn’s multiple comparisons). Additional biochemistry data are presented in S2 Table.

