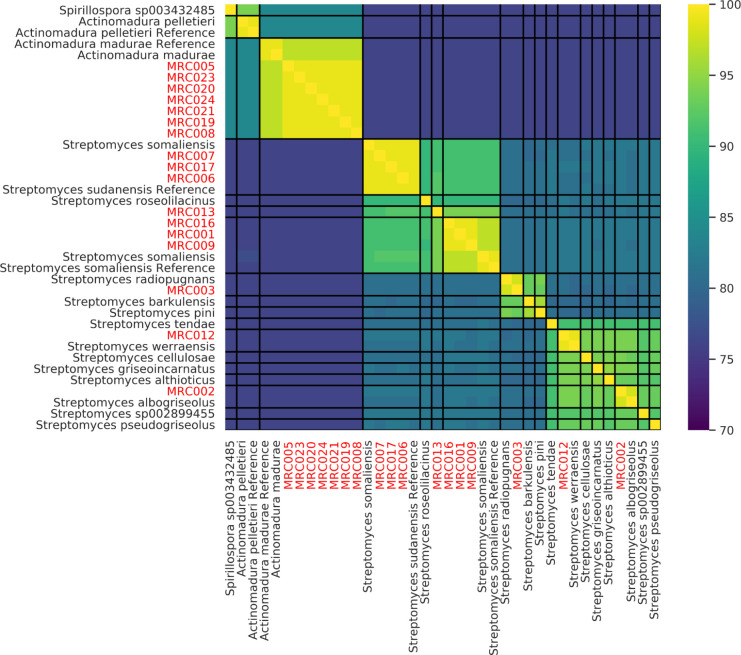
Fig 4.
Pairwise comparison of Average Nucleotide Identity between the genomes of Isolates from the Mycetoma Research Centre (red) and their closest relatives in GTDB (all genomes from GTDB with an ANI >90 with any single isolate genome or the genome of type strains). The heatmap is ordered based on hierarchical clustering (Ward, Euclidean distance). Black lines delineate species boundaries based on ANI > 95%. The genomes of the reference species are from type strains.

