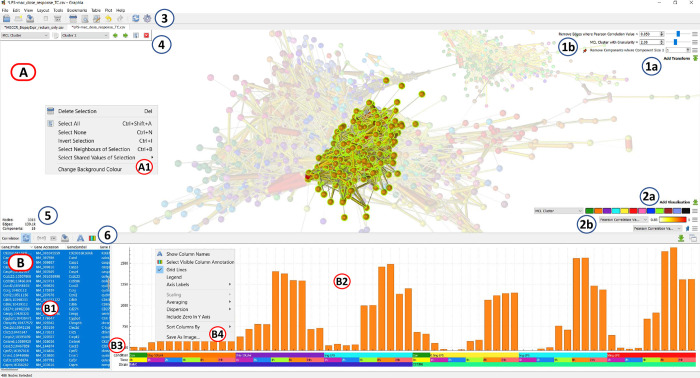
Fig 1. Graphia user interface displaying a correlation graph.
(A) Graph display area, showing correlation graph with a cluster selected (unselected nodes faded). (A1) Display context menu options (right click). (B) Node (row) attribute display area. (B1) Table of selected nodes and their attributes, imported and calculated within the tool. (B2) Data plot area, in the case shown here a mean histogram of selected node values. (B3) Visualisation of column annotations. (B4) Data plot context menu options for changing plot (right click). (1a) Add Transform button, (1b) Active transforms, (2a) Add visualisation button, (2b) Active visualisations, (3) General toolbar, (4) Attribute parameter selection, (5) Display of graph metrics (number of nodes, edges, components), (6) Plot/table function toolbar.

