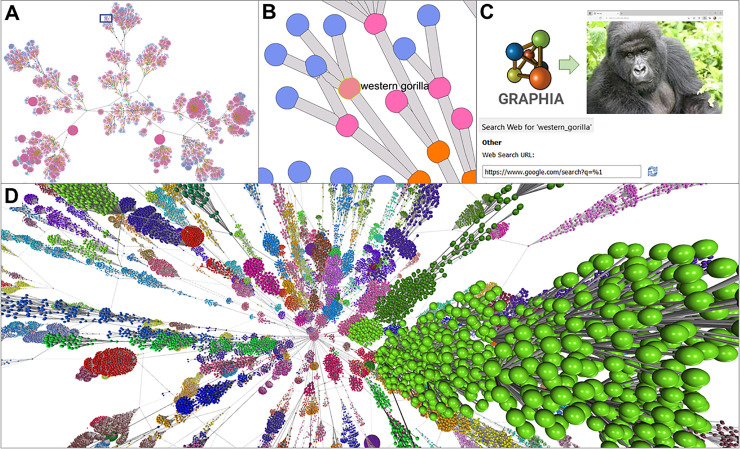
Fig 3. Visualisation of taxonomic trees.
(A) A taxonomic tree of all mammals was downloaded from the NCBI’s Taxonomy database, with nodes coloured according to type, i.e. subspecies (blue), species (pink), genus (orange), etc. The graph comprised of 9,843 nodes and 9,862 edges and is shown with a 2D layout. (B) Zoomed-in view of the area in square shown in A, with a single node selected (Western gorilla). (C) Right click on a node provides the ability to search the web for the node identifier either via Google or through a predefined database selected in the Network tab of Options dialogue. (D) Taxonomic tree of all insects from the NCBI’s Taxonomy database, nodes coloured by Louvain cluster. The graph consists of 275,328 nodes and 275,528 edges and in this respect represents a large graph where visualisation in 2D is challenging.

