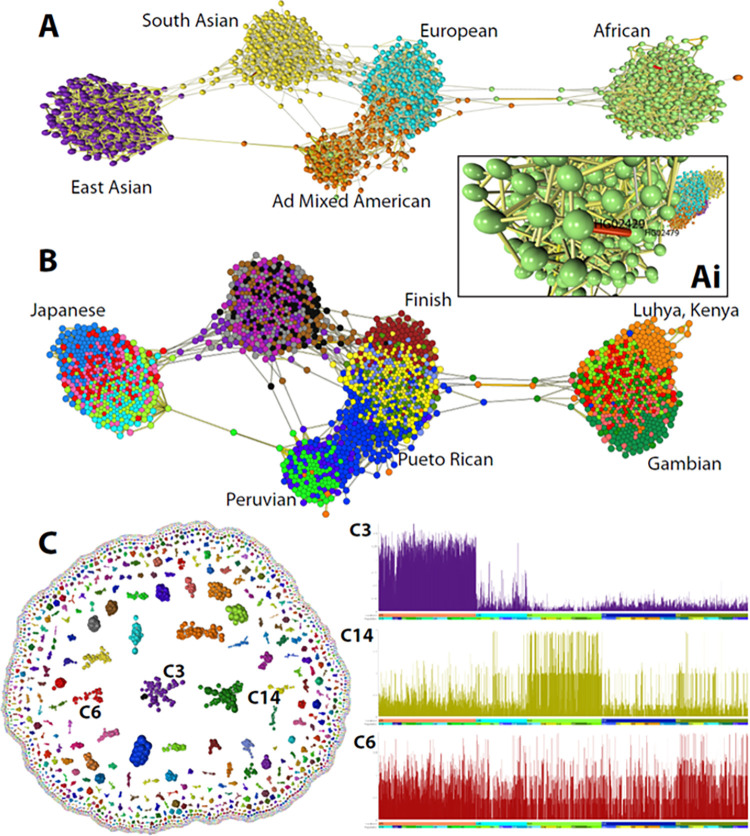
Fig 6. Analysis of single nucleotide genome variant data.
(A) The graph shown was constructed from data from the 1000 genomes project based on the correlation (r threshold = 0.238) between the allele dosages at 23,675 SNVs from chromosome 22. Nodes represent the 2,504 individuals included in the study and edges the three most significant correlations with their neighbours (k-NN was applied where k = 3). In most cases, individuals’ group with others from the same continent although there are instances where this does not appear to be the case. Visualisation of edge weights (Ai) also highlights cases where individuals would appear to be closely related. (B) Colouring of nodes by the attribute ‘population’ provides a higher resolution to the graph and populations showing a high degree homogeneity have been labelled. (C) Transposing the data upon import demonstrates SNVs whose pattern across the genome covaries. Clustering of these data shows many to represent haplotype blocks and inspection of their profile across genomes, demonstrates some SNV clusters to be associated with a given ethnic grouping, e.g. cluster 3 (Africans) and cluster 14 (East Asia), whilst others little obvious association with ethnicity, e.g. cluster 6. Plots show the average score of SNV’s within a cluster (y-axis, 0,1,2), across the 2,504 individuals ordered by continent and then population (x-axis).

