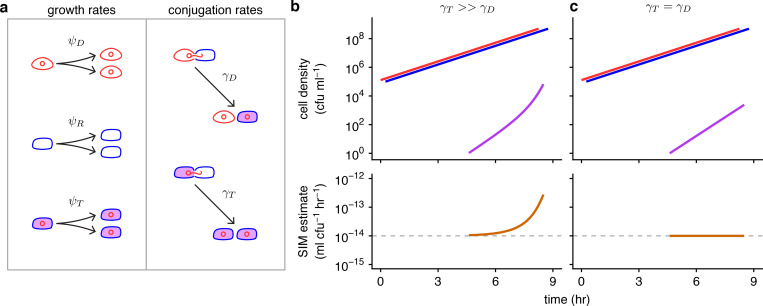
Fig 1. Basic model parameters and the effects of unequal conjugation rates on the SIM estimate.
(a) In this schematic, the conjugative plasmid is a red circle, a donor is a red cell containing the plasmid, a recipient is a blue cell, and a transconjugant is indicated with a purple interior (a blue cell containing a red plasmid). The ψD, ψR, and ψT parameters are donor, recipient, and transconjugant growth rates, respectively, illustrated by 1 cell dividing into 2. The γD and γT parameters are donor and transconjugant conjugation rates, respectively, shown by conjugation events transforming recipients into transconjugants. (b) When the transconjugant conjugation rate (γT) is higher than the donor conjugation rate (γD), transconjugants exhibit superexponential increase (purple curve) while donors and recipients increase exponentially (red and blue lines). The SIM estimate (orange line) increases over time, deviating from the actual donor conjugation rate (gray dashed line). (c) In contrast, when the conjugation rates are equal (γT = γD), the transconjugant increase is muted relative to part b (purple line). The SIM assumptions are met, and the estimate is constant and accurate over time (orange line). Eqs 1–3 were used to produce the top graphs, with D0 = R0 = 105, T0 = 0, ψD = ψR = ψT = 1, γD = 10−14, and either γT = 10−8 (in part b) or γT = 10−14 (in part c). The donor and recipient trajectories overlapped but were staggered for visibility. Eq 4 was used to produce the bottom graphs. The code needed to generate this figure can be found at https://github.com/livkosterlitz/LDM or https://doi.org/10.5281/zenodo.6677158.

