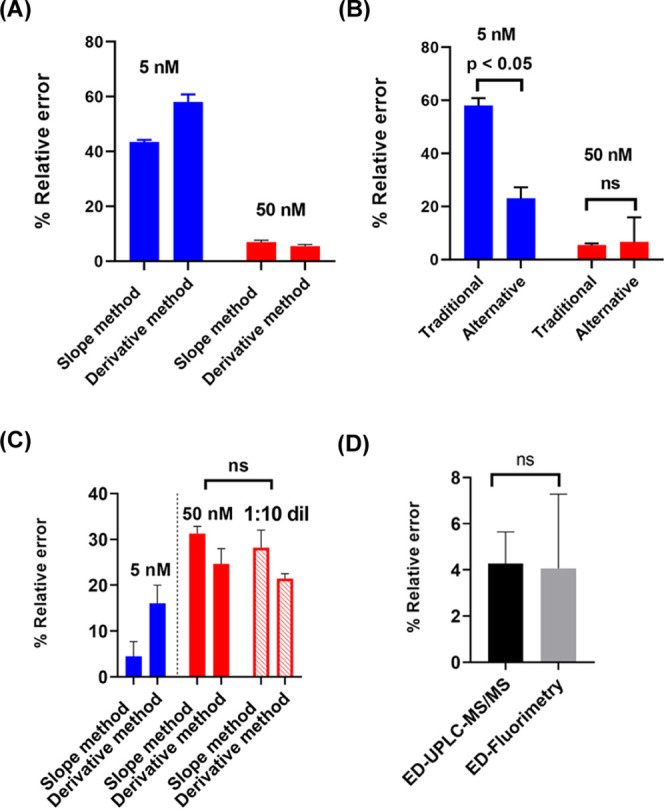
Figure 3.

Statistical comparisons of % relative errors associated with determining the antibody binding-site concentration using ED-UPLC-MS/MS vs ED-fluorimetry. (A) Comparison of % relative errors in calculating the antibody binding-site concentration in 5 nM 6-AmHap-acetamide (blue, low hapten-acetamide tracer concentration) and 50 nM 6-AmHap-acetamide (red, high hapten-acetamide tracer concentration) using UPLC-MS/MS. (B) Comparison of % relative errors in the measured antibody binding-site concentrations using traditional vs alternative ED experiments at low and high hapten-acetamide tracers and mAb concentrations. (C) Comparison of % relative errors in 5 nM (blue, low hapten-fluorophore tracer concentration) vs 50 nM (red, high hapten-fluorophore tracer concentration) 6-AmHap-Cy5 by ED-fluorimetry (solid red: fluorescence data collected at low laser power; hollow red: fluorescence data collected at high laser power in a 1:10 dilution of ED samples/buffers). (D) Comparison of % relative errors associated with measuring the antibody binding-site concentration at 50 nM 6-AmHap-acetamide using UPLC-MS/MS (black) vs at 5 nM 6-AmHap-Cy5 using ED-fluorimetry (gray).
