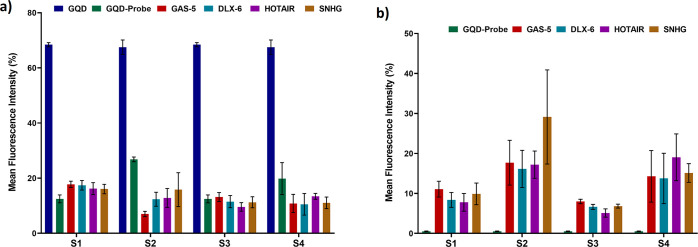
Figure 6.
Graph showing the change in the fluorescence intensity of the GQD—probe nanohybrids upon the precise hybridization of the target lncRNAs. (a) GQD fluorescence (b) PI. The values are observed by flow cytometry and expressed in terms of mean ± SE (n = 3) for GQD alone, GQD-probe nanoconjugate, and GQD-probe nanoconjugate with different lncRNAs (GAS5, DLX, HOTAIR, and SNHG).

