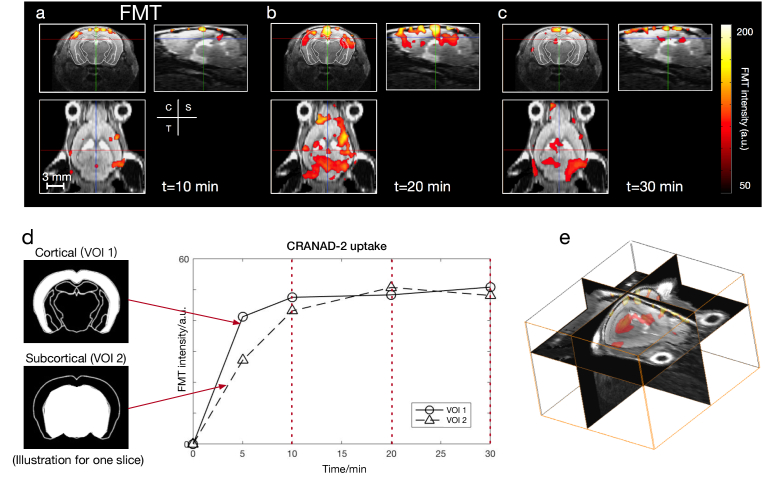
Fig. 2.
FMT reconstruction for visualizing CRANAD-2 distribution within the brain of one representative arcAβ mouse. FMT reconstruction shows variations at time points at t = 10, 20, and 30 minutes (a, b, c). VOIs at cortical and subcortical regions are indicated by two images of different masks in (d). The temporal variation in CRANAD-2 in the two VOIs is shown in (d). For the cortex (solid line), the uptake of CRANAD-2 increased for the first 20 minutes. For the subcortical region (dashed line), the concentration of CRANAD-2 dropped after 20 minutes. (e) 3D visualization of FMT-MRI (t = 30 min).

