Fig. 3.
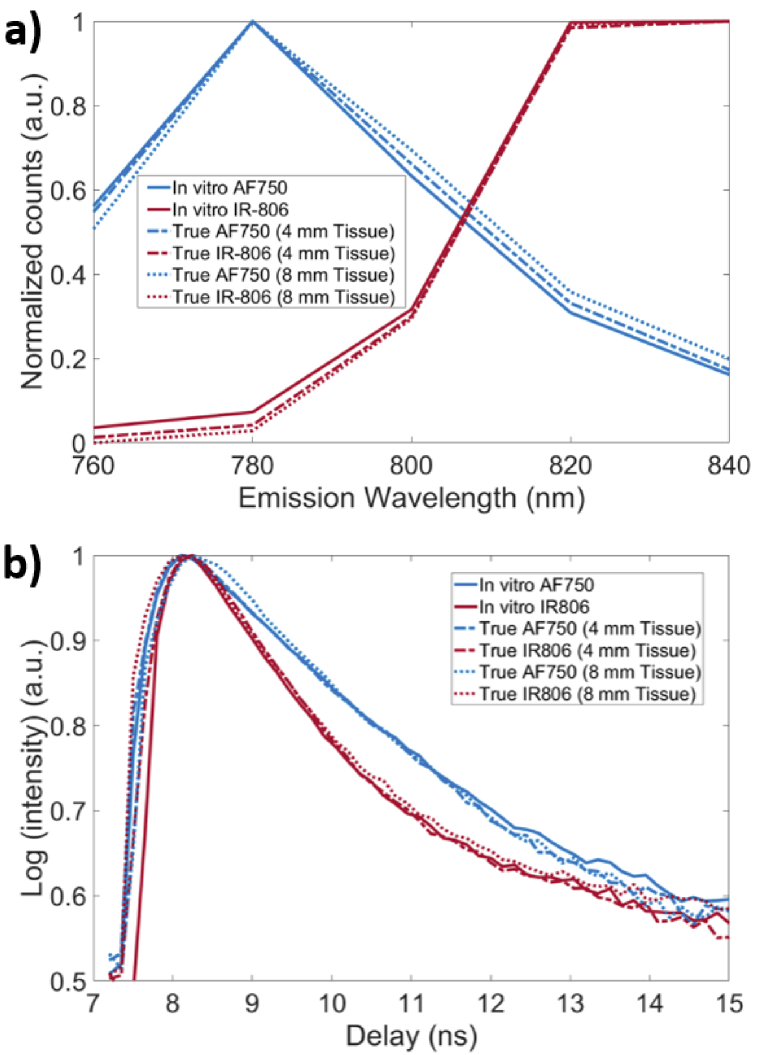
Fluorescence emission spectra and TD fluorescence decay curves of IR-806 and AF750 in thick biological tissue. Emission spectra and TD fluorescence of IR-806 and AF750 are represented in ‘red’ and ‘blue’ colors, respectively. (a) In vitro emission spectra of IR-806 (red solid) and AF750 (blue solid) are shown along with the true emission spectra of IR-806 (red dashed) and AF750 (blue dashed) in 4 mm thick tissue. Redshifted emission spectra were observed for both IR-806 and AF750 in tissue. A further redshift of IR-806 (red dotted) and AF 750 (blue dotted) emission spectra was observed in 8 mm thick tissue. (b) In vitro TD fluorescence decay curves of IR-806 (red solid) and AF750 (blue solid) with distinct FLTs (0.6 ns and 0.9 ns, respectively) are shown. True fluorescence decay curves of IR-806 and AF750 in 4 mm (dashed) or 8 mm (dotted) thick tissue were nearly identical to the in vitro decay curves.

