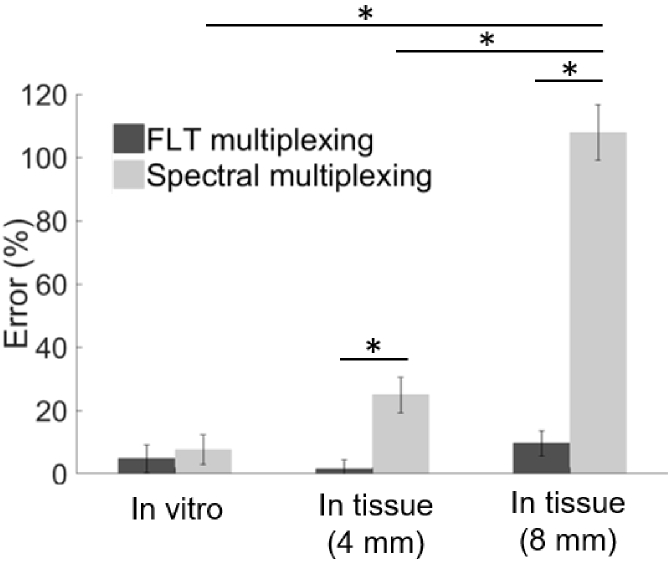
Fig. 5.
Percent error of relative quantitation by MSI and FLT multiplexing. Bar graphs represents the mean of percent errors calculated for five mixed solutions of IR-806 and AF750 under in vitro conditions and in tissue of varying thickness (4 mm and 8 mm). Standard deviations represent variance of recovered fluorescence yield ratios. Black: FLT multiplexing. Gray: MSI. p * < 0.01

