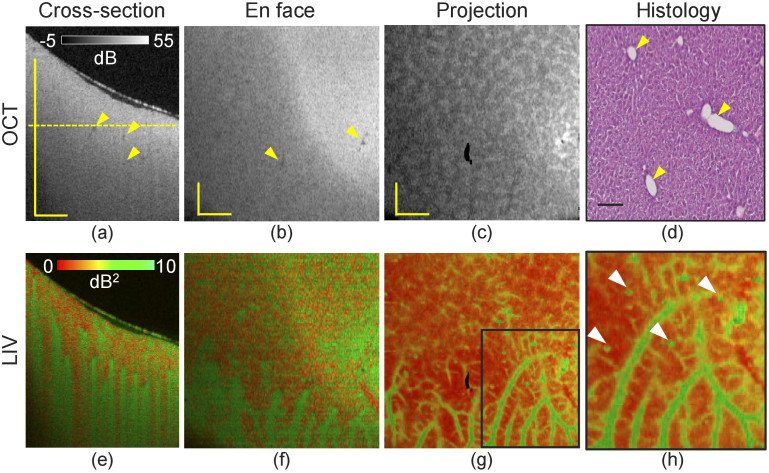
Fig. 1.
Dynamics imaging of a normal-diet induced mouse liver. Cross-sections of (a) scattering OCT and (e) LIV images. (b, f) En face slices of the OCT and LIV images at the depth location indicated by the horizontal line in (a). (c, g) Slab projection images of OCT and LIV. (d) H&E staining histological micrograph. (h) Magnified image of the LIV projection image at the region marked by the rectangular box in (g). All scale bars indicate 1 mm.

