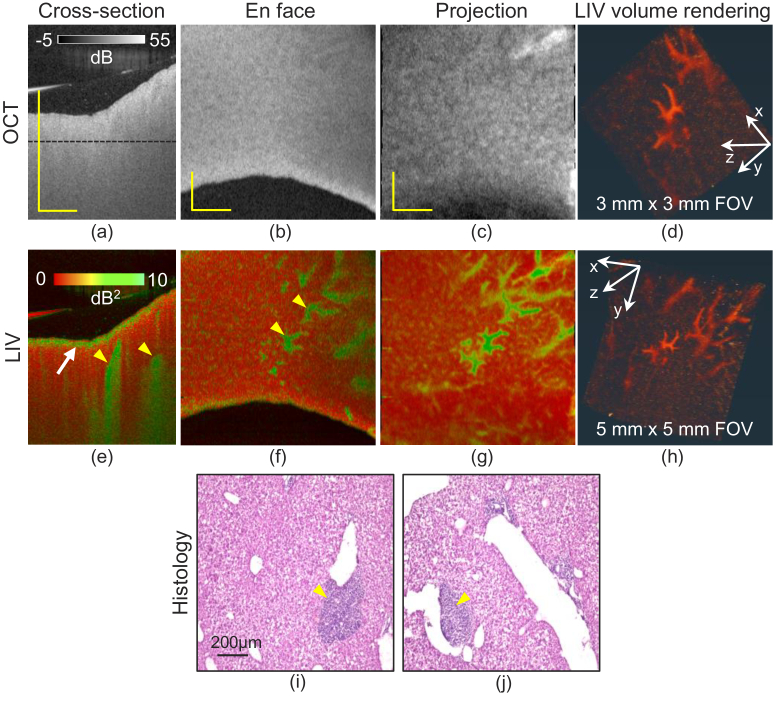
Fig. 3.
The results of 2-week MCD diet induced NAFLD model liver. The first to the third columns show the cross-sectional images (a, e), the en face slices (b, f), and the slab projections (c, g) of OCT intensity (first row) and LIV (second row) respectively. The fourth column (d, h) shows the volume renderings of LIV with two different FOVs. The last row (i, j) shows the H&E stained histological micrographs. The scale bars of OCT intensity and LIV represent 1 mm and that in histology indicate 200 m.

