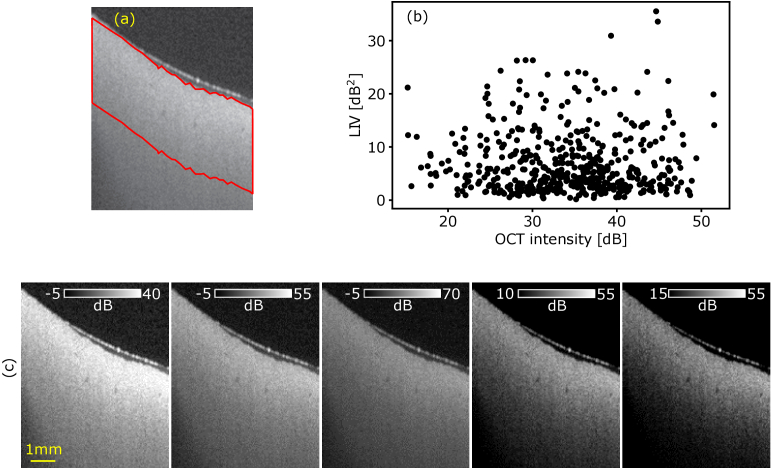
Fig. 5.
Scatter plot between dB-scale OCT intensity and LIV (b) at the region delineated by red line in (a). No evident correlation was found between the dB-scale OCT intensity and LIV. (c) The OCT intensity of Fig. 1(a) is displayed at different intensity ranges. The vertical stripe structure shown in the LIV image [Fig. 1(e)] is not visible in the intensity images.

