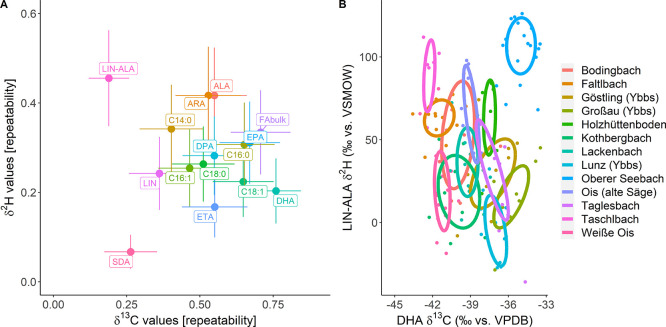
Figure 4.
(A) Site-specific repeatability analysis, controlling for taxa, tissue type, and sampling year, revealed high site specificity for n – 3 LC-PUFA (e.g., DHA and EPA) 13C-CSIA, but not for 2H-CSIA, in which ALA and ARA showed higher specificity. (B) Plotting the isotopic difference between δ2HALA and δ2HLIN against δ13CDHA already revealed site-specific clusters in the fish muscle tissue (ellipses show 50% CI). More distinct site-specific separation was achieved when plotting the first three dimensions of a linear discrimination analysis, which can be seen in the interactive view of the online Supporting Information of this article (Figure S3: δ2H and δ13C values of 11 FA quantified in all samples; proportions of trace: LD1 = 48.2%, LD2 = 23.6%, LD3 = 7.8%).

