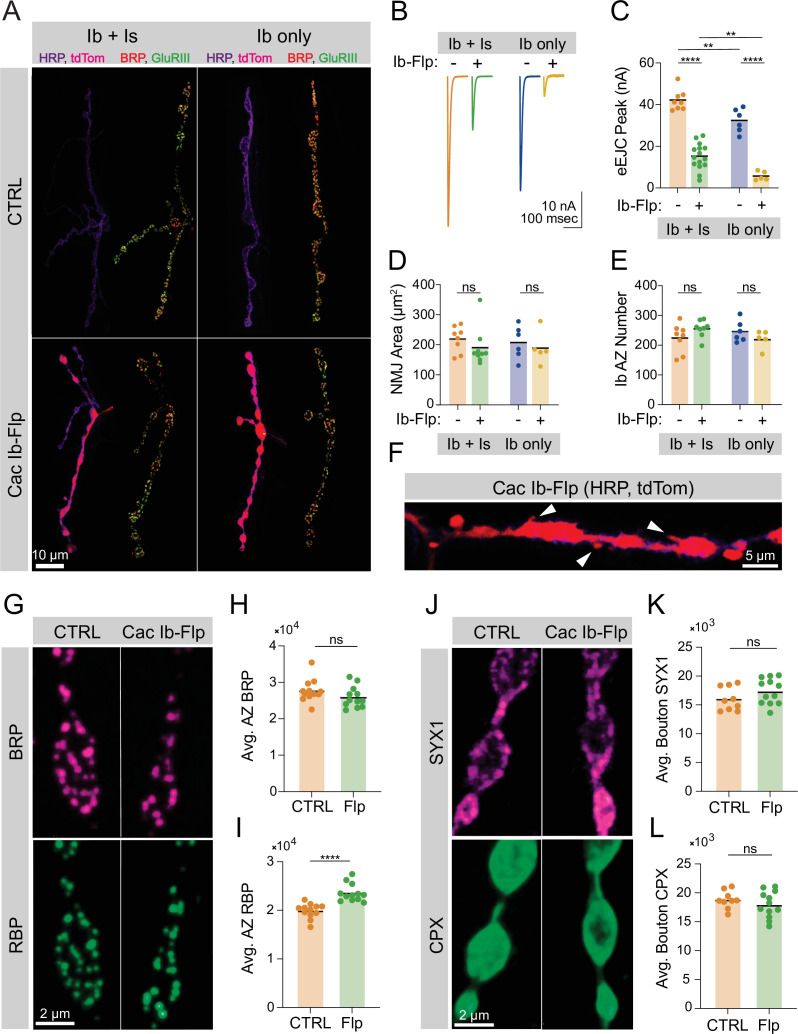
Figure 1. Ca2+ channels are not required for active zone (AZ) seeding or scaffold accumulation.
(A) Representative images of control neuromuscular junctions (NMJs) with both Ib and Is motoneurons co-innervating muscle 1 (top left), or muscle 1 with only Ib innervation (top right), and Is and cac-flipped Ib neurons co-innervating muscle 1 (bottom left) or cac-flipped Ib neurons with no Is present (bottom right). The flip-reporter tdTomato (magenta) and HRP (neuronal membranes; purple) were imaged prior to fixation (left panels). After fixation, NMJs were immunostained for Bruchpilot (BRP) (red) and GluRIII (green) to label AZs and PSDs, respectively (right panels). (B, C) Average traces and evoked amplitudes (peak current, nA) from the indicated genotypes (co-innervated controls: orange, 42.11±1.757, n=8 NMJs from 6 animals; co-innervated CacIb-flp: green, 15.13±1.607, n=15 NMJs from 12 animals, p<0.0001; Ib-only controls: blue, 32.32±2.329, n=6 NMJs from 6 animals; Ib-only CacIb-flp: gold, 5.749±0.9544, n=5 NMJs from 5 animals, p<0.0001). (D) Neuronal (HRP-stained) area of Ib synapses (co-innervated controls: orange, 219.1±15.15, n=8 NMJs from 6 animals; co-innervated CacIb-flp: green, 190.4±21.12, 9 NMJs from 8 animals; Ib-only controls: blue, 207.8±22.4, n=6 NMJs from 6 animals; Ib-only CacIb-flp: gold, 189±24.59, n=5 NMJs from 5 animals). (E) Number of AZs formed by Ib synapses (co-innervated controls: orange, 224.3±16.88; co-innervated CacIb-flp: green, 255.1±10.13; Ib-only controls: blue, 245.8±14.73; Ib-only CacIb-flp: gold, 220.4±13.47). (F) Some NMJs lacking Cac display ectopic filopodia extending from boutons (white arrowheads). (G) Representative images of cac-flipped NMJs stained with anti-BRP (magenta) and anti-RIM-binding protein (RBP) (green). (H) Quantification of BRP abundance. Each point represents the average fluorescence intensity across the AZ population of a single NMJ (CTRL: orange, 27,736±900.2, n=12 NMJs from 6 animals; CacIb-flp: green, 25,943±843.7, n=12 NMJs from 6 animals). (I) Quantification of RBP abundance (CTRL: orange, 19,910±439.2; CacIb-flp: green, 23,593±530.6, p<0.0001). (J) Representative images of cac-flipped animals stained for syntaxin 1 (SYX1) (magenta) and complexin (CPX) (green). (K) Quantification of SYX1 abundance. Each point represents the average fluorescence intensity across the bouton population of a single NMJ (CTRL: orange, 16,028±683.5, n=9 NMJs from 5 animals; CacIb-flp: green, 17365±643.4, n=12 NMJs from 6 animals). (L) Quantification of CPX abundance (CTRL: orange, 18,810±509.4; CacIb-flp: green, 17,961±663.5).


