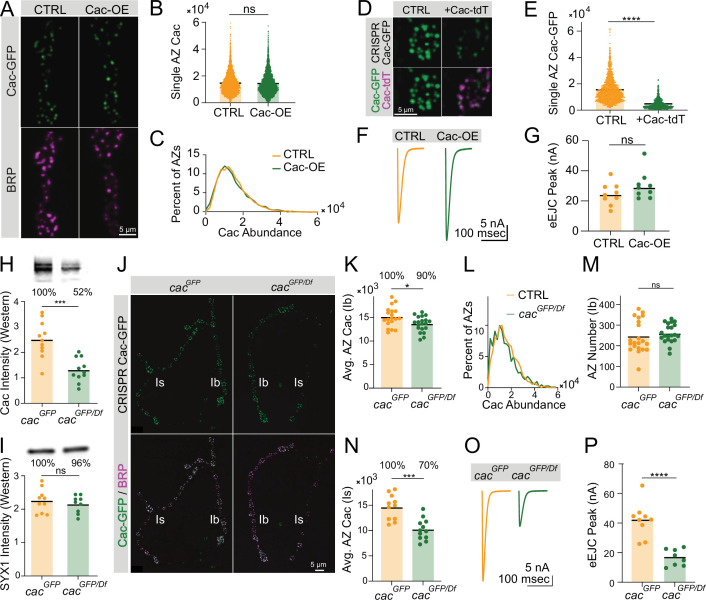
Figure 3. Active zone (AZ) Cac accumulation is regulated downstream of Cac biosynthesis.
(A) Representative images of Cac-GFP (green) and Bruchpilot (BRP) (magenta) at muscle 4 for endogenously C-terminally tagged Cac-GFP controls (cacGFP(C),C155/cacGFP(C)) and Cac overexpression animals (cacGFP(C),C155/cacGFP(C),UAS-Cac-GFP). (B) Quantification of AZ Cac intensity in control versus Cac overexpression neuromuscular junctions (NMJs). Each point represents the maximum Cac-GFP pixel intensity of a single AZ (control: 14617±130.8, n=3663 AZs from 10 NMJs from 6 animals; Cac OE: 14,383±148.2, n=3145 AZs from 10 NMJs from 6 animals). (C) Distribution of AZ Cac-GFP abundance across the AZ population in control versus Cac overexpression NMJs. (D) Representative images of endogenously tagged Cac-GFP (green) and overexpressed Cac-tdTomato (magenta) at AZs in control (cacGFP,C155) versus Cac-tdTomato overexpression (cacGFP,C155;UAS-Cac-tdT). (E) Quantification of AZ Cac-GFP intensity with and without Cac-tdTomato overexpression (control: 15,339±232, n=1613 AZs, Cac-tdT: 4477±123.9, n=850 AZs, p<0.0001). (F, G) Average traces and evoked peak currents (nA) at muscle 6 in Cac overexpression and control animals (control: 24.45±2.433, n=9 NMJs from 5 animals; Cac OE: 30.11±3.046, n=9 NMJs from 5 animals). (H, I) Quantifications and representative images of Western blots of adult head extracts from cacGFP/Df heterozygotes and cacGFP controls (n=11 samples, extracts from 5 adult heads per sample). Each point in H represents Cac intensity in one lane (cacGFP: 25,092±2146; cacGFP/Df: 13,055±1403, p<0.001). Each point in I represents syntaxin 1 (SYX1) intensity in one lane (cacGFP: 224,900±11,239; cacGFP/Df: 214,889±86,96). Representative images for Cac and SYX are shown above each quantification. (J) Representative images of endogenous Cac-GFP (green) and BRP (magenta) at muscle 4 AZs in cacGFP/Df heterozygotes and cacGFP controls. Ib and Is terminals are labeled in white. (K) Quantification of average Cac-GFP AZ abundance per MN4-Ib NMJs (cacGFP: 15,105±486.3, n=19 NMJs from 7 animals; cacGFP/Df: 13,617±365.9, n=21 NMJs from 7 animals, p<0.05). (L) Histogram of Cac-GFP intensity across the AZ population in cacGFP/Df heterozygotes and cacGFP controls at MN4-Ib NMJs. (M) BRP-positive AZ number per MN4-Ib NMJ (cacGFP: 243.4±17.05; cacGFP/Df: 260.3±9.963). (N) Quantification of average AZ Cac-GFP intensity per Is innervation of muscle 4 NMJs (cacGFP: 14,621±747.5, n=11 NMJs from 7 animals; cacGFP/Df: 10,219±601 n=12 NMJs from 7 animals, p<0.001). (O, P) Average traces and evoked peak currents (nA) at muscle 6 in cacGFP/Df heterozygotes and cacGFP controls (cacGFP: 41.96±3.879, n=9 NMJs from 5 animals; cacGFP/Df: 16.7±1.984, n=8 NMJs from 7 animals, p<0.0001).


