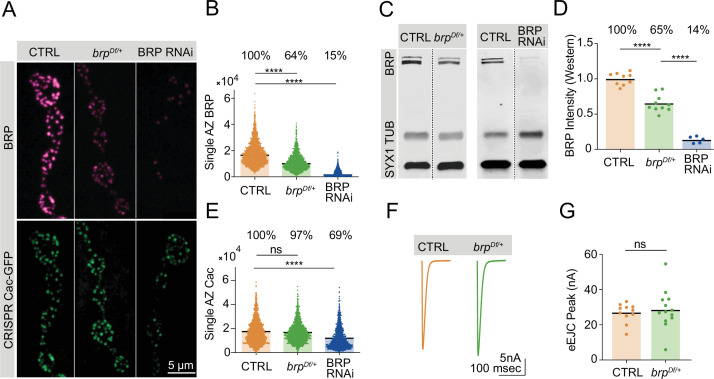
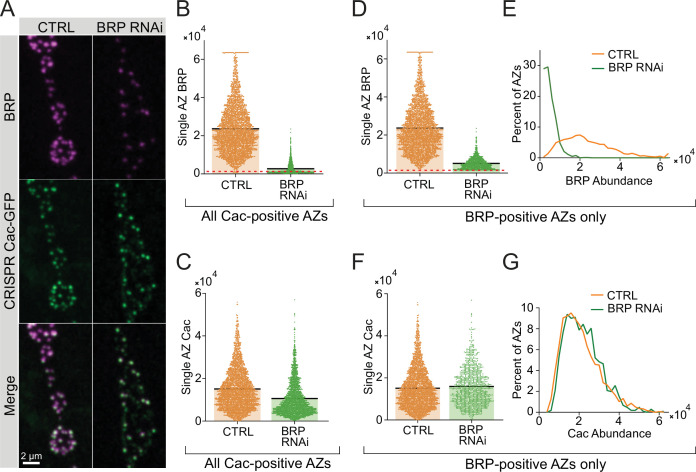
Figure 4. Bruchpilot (BRP) biosynthesis rate-limits active zone (AZ) BRP incorporation.
(A) Representative images of BRP and endogenously tagged Cac-GFP at AZs in controls, brpDf/+ heterozygotes and pan-neuronally (elav-GAL4) expressed BRP RNAi. (B) Quantification of single AZ BRP intensity, with average AZ BRP intensity listed as a percent of control above each genotype (control: 18,161±210.7, n=1779 AZs; brpDf/+: 11,534±176.7, n=1350 AZs, p<0.0001; BRP RNAi: 2806±79.91, n=1140 AZs, p<0.0001). (C) Representative image of Western blots of adult head extracts from control and brpDf/+ heterozygotes (left panel), and control and pan-neuronally expressed BRP RNAi animals (right panel) stained for syntaxin 1 (SYX1) (loading control), Tubulin, and BRP. (D) Quantification of BRP intensity in Western blots of the indicated genotypes. Each point represents BRP intensity in one lane, with BRP intensity normalized to the SYX1 loading control. Percent of protein abundance compared to control (100%) is shown above each genotype (control: 1.0±0.02912, n=9 lanes; brpDf/+: 0.6518±0.03862, n=10 lanes, p<0.0001; BRP RNAi: 0.1366±0.02117, n=5 lanes, p<0.0001). (E) Quantification of endogenously tagged Cac-GFP intensity at single AZs in controls, brpDf/+ heterozygotes, and pan-neuronally expressed BRP RNAi (control: 17,268±232.4, n=1757 AZs; brpDf/+: 16,788±217, n=1403 AZs; BRP RNAi: 11,959±259, n=1140 AZs, p<0.0001). (F, G) Average traces and quantified evoked peak currents (nA) in control and brpDf/+ heterozygotes at muscle 6 (control: 26.78±1.632, n=11 neuromuscular junctions (NMJs); brpDf/+: 28.71±3.105, n=13 NMJs).


