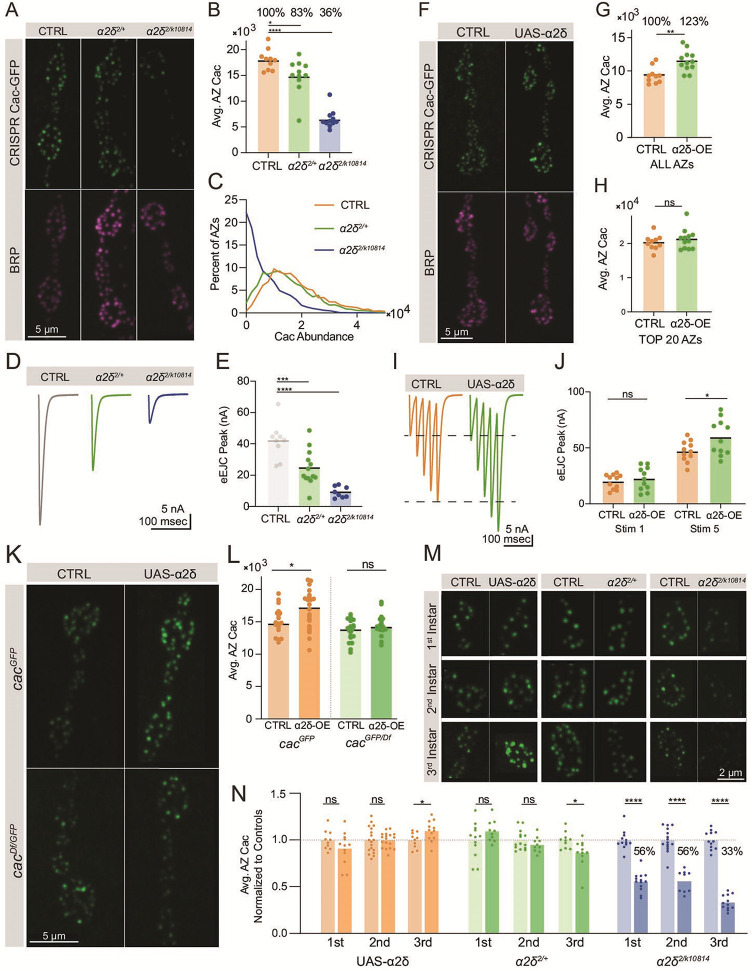
Figure 5. Cac accumulation at active zones (AZs) is dosage sensitive to the α2δ subunit.
(A) Representative images of endogenously tagged Cac-GFP (green) and Bruchpilot (BRP) (magenta) in controls (cacGFP), α2δ null heterozygotes (cacGFP;α2δ2/+) and α2δ2/k10814 transheterozygotes (cacGFP;α2δ2/k10814). (B) Quantification of average AZ Cac-GFP fluorescence of neuromuscular junctions (NMJs) in each genotype. Cac abundance as a percent of control levels is shown above each genotype (control: 18,007±641.1, n=10 NMJs from 5 animals; α2δ2/+: 14,926±1014, n=11 NMJs from 6 animals, p=0.0174; α2δ2/k10814: 6542±541.3, n=11 NMJs from 6 animals, p<0.0001). (C) Frequency distribution of single AZ Cac-GFP intensity across the AZ population in each genotype. (D, E) Average traces and quantified evoked peak current (nA) at muscle 6 for each genotype. Recordings were collected in combination with cacGFP/Df heterozygotes (Figure 3P) and the control is replicated here in gray for ease of comparison (control: 41.96±3.879, n=9 NMJs; α2δ2/+: 24.53±3.133, n=13 NMJs, p<0.001; α2δ2/k10814: 9.161±1.268, n=8 NMJs, p<0.0001). (F) Representative images of endogenously tagged Cac-GFP (green) and BRP (magenta) in control (cacGFP,C155) and α2δ overexpression animals (cacGFP,C155;;UAS-α2δ). (G) Average AZ Cac abundance per NMJ (control: 9332±388.6, n=10 NMJs from 5 animals; α2δ OE: 11497±449.8, n=12 NMJs from 6 animals, p=0.0019). (H) Average of top 20 brightest AZs per NMJ (control: 22,996±752.5; α2δ OE: 24,823±1011). (I, J) Average traces and quantified 1st and 5th stimulus evoked peak current at muscle 6 in 0.25 mM external Ca2+ for controls and α2δ overexpression animals (control 1st: 19.87±1.98, n=11 NMJs; α2δ OE 1st: 22.45±3.127, n=11 NMJs; control 5th: 46.82±2.794; α2δ OE 5th: 59.21±4.839, p=0.0249). (K, L) Representative images and quantification of endogenously tagged Cac-GFP with (right) and without (left) α2δ overexpression in either control (top) or cacGFP/Df heterozygous (bottom) NMJs (cacGFP,C155: 15,105±486.3, n=19 NMJs; cacGFP,C155;UAS-α2δ/+: 17,142±814.4, n=15 NMJs, p<0.0225; cacDf/cacGFP,C155: 13,617±365.9, n=20 NMJs; cacDf/cacGFP,C155;UAS-α2δ/+: 14,895±587, n=12 NMJs). (M, N) Representative images and quantification of average AZ Cac intensity per NMJ of endogenously tagged Cac-GFP in 1st, 2nd, and 3rd instar muscle 4 Ib NMJs in α2δ overexpression, α2δ2/+, and α2δ2/k10814 animals. Each pairwise comparison was normalized so that the control average is 1.0 (α2δ-OE 1st: 0.9125±0.0496, n=12 NMJs; α2δ-OE 2nd: 1±0.019, n=18 NMJs; α2δ-OE 3rd: 1.098±0,03132, n=12 NMJs, p=0.0296; α2δ2/+1st: 1.096±0.0361, n=10 NMJs; α2δ2/+ 2nd: 0.9525±0.02574, n=10 NMJs; α2δ2/+ 3rd, p=0.0213; 0.8661±0.04408, n=11 NMJs; α2δ2/k10814 1st: 0.5569±0.02853, n=15 NMJs, p<0.0001; α2δ2/k10814 2nd: 0.5619±0.03902, n=9 NMJs, p<0.0001; α2δ2/k10814 3rd: 0.3344±0.02298, n=12 NMJs, p<0.0001).


