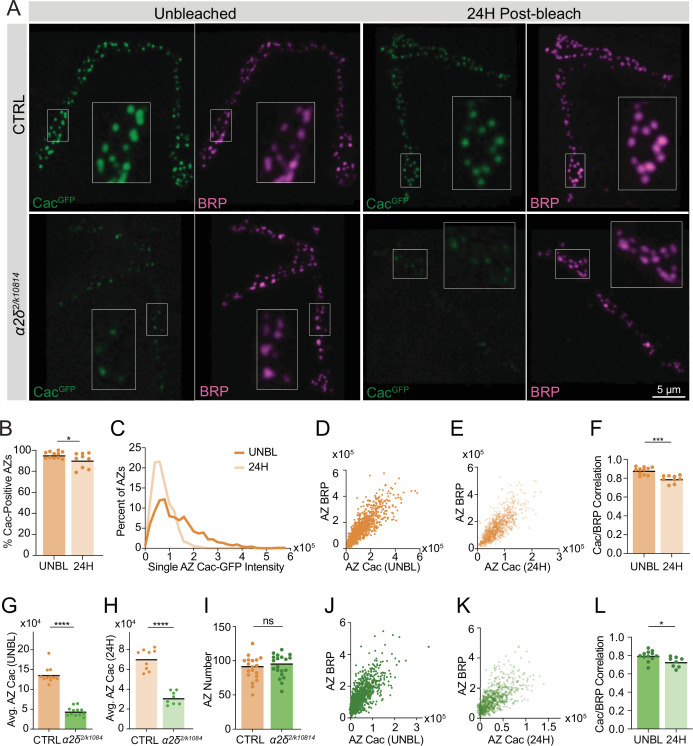
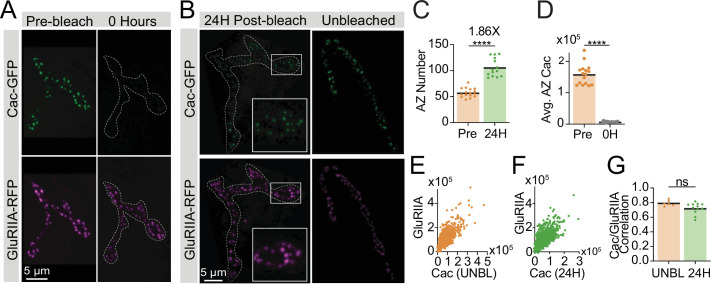
Figure 6. Cac delivery to active zones (AZs) correlates with AZ size and is regulated by α2δ.
(A) Representative images of FRAP experiments in CTRL (cacGFP) and α2δ mutant (cacGFP;α2δ2/k10814) neuromuscular junctions (NMJs). Fixed and Bruchpilot (BRP)-immunostained (magenta) NMJs are shown 24 hr post-bleaching, with unbleached NMJs as a control. Boutons inside white boxes are enlarged. (B) Percent of BRP-positive AZs with Cac-GFP max pixel intensity greater than 150% of average background fluorescence (pre: 95.56±0.9347; 0H: 90.37±2.347, p=0.0422). (C) Distribution of single AZ Cac-GFP intensity (sum Cac-GFP fluorescence within an ROI encompassing each BRP-positive AZ) in unbleached NMJs (UNBL) and 24 hr after bleaching (pre: 13,6052±3018, n=946 AZs; 24H: 72,261±1389, n=804 AZs). (D, E) Correlations of Cac-GFP and BRP at individual AZs in unbleached controls (D) and NMJs 24 hr post-bleach (E). (F) Pearson r value for the correlation of Cac-GFP and BRP intensity across the AZ population at each NMJ in unbleached control NMJs (UNBL) and 24 hr post-bleach (pre: 0.8801±0.01191; 24H: 0.7913±0.01348, p<0.001). (G) Average AZ Cac-GFP intensity in unbleached segments in cacGFP and α2δ2/k10814 NMJs (cacGFP: 136,462±6346, n=11 NMJs; α2δ2/k10814: 44,340±3252, n=12 NMJs, p<0.0001). (H) Average AZ Cac-GFP intensity 24 hr post-bleach (cacGFP: 70,528±3508, n=9 NMJs; α2δ2/k10814: 31,086±2326, n=8 NMJs, p<0.0001). (I) AZ number at NMJs (cacGFP: 88.26±4.13, n=19 NMJs; α2δ2/k10814: 92.45±3.689, n=20 NMJs). (J, K) Correlation of Cac-GFP and BRP at individual AZs in unbleached α2δ2/k10814 mutants (J) and α2δ2/k10814 NMJs 24 hr post-bleach (K). (L) Pearson r value for the correlation of Cac-GFP and BRP intensity across the AZ population in unbleached NMJs (UNBL) and NMJs 24 hr post-bleach in α2δ2/k10814 mutants (UNBL: 0.7952±0.01635; 24H: 0.7285±0.01955, p=0.018).


