. 2022 Jul 21;11:e80470. doi: 10.7554/eLife.80470

Figure 1. High sensitivity and narrow tuning of olfactory sensory input to OB glomeruli.

(A) Coverage of physicochemical space by the 185-odorant panel. Grey points show the projection of 2,587 odorants across the first two principal components of a matrix of physicochemical descriptors, as in Pashkovski et al., 2020 (see Materials and methods). Black points indicate the odorants tested in the 185-odorant panel. (B) Baseline fluorescence (left), maximal projection of response maps across the 185-odorant panel (middle), and ROIs of responsive glomeruli (right). (C) Estimated delivered concentrations used across the odorant panel. Histogram and black cumulative distribution function show concentrations of each presented odorant across four preparations (n=740). Red cumulative distribution function shows the minimal effective concentration for each responsive glomerulus (n=993). (D) Response maps evoked by single odorants for the preparation shown in (B). Each row shows distinct but neighboring glomeruli (demarcated by filled and open arrowheads) activated by structurally similar odorants. Estimated concentrations are rounded to single-significant digit precision. (E) Matrix of responses across all responsive glomeruli in one OB. Each row (glomerulus) is normalized to its maximal response across the odorant panel. Glomeruli are sorted in order of their maximally-activating odorant, producing a pseudo-diagonalized matrix. Odorants are ordered according to nominal structural classification (see Materials and methods). Matrix includes responses to empty and solvent controls. (F, G) Response spectra of all imaged glomeruli (rows) across the odorant panel (columns), normalized by maximal response, for 1 x concentration epifluorescence dataset and the 10 x concentration two-photon dataset (separate preparations; 10 x two-photon data imaged from a smaller field of view containing fewer glomeruli). Odorant order sorted by response amplitude; glomerular order sorted by lifetime sparseness. (H) Histogram and cumulative distribution functions of lifetime sparseness (SL) values for all responsive glomeruli for the odorant panel presented at original, 1 x concentrations (red; n=993 glomeruli) and at 10 x concentrations (blue; n=100). Shading denotes 95% confidence intervals (calculated using ‘ecdf’ function in Matlab). (I) Percent of variance in glomerular responses to the odorant panel explained by each successive PC, plotted for each OB. Red plots: 1 x concentrations, n=8 OBs; blue plots: 10 x concentrations, n=2 OBs. (J) Cumulative variance in glomerular responses to the odorant panel explained by increasing fractions of possible PCs (constrained by the number of responsive glomeruli in each OB).

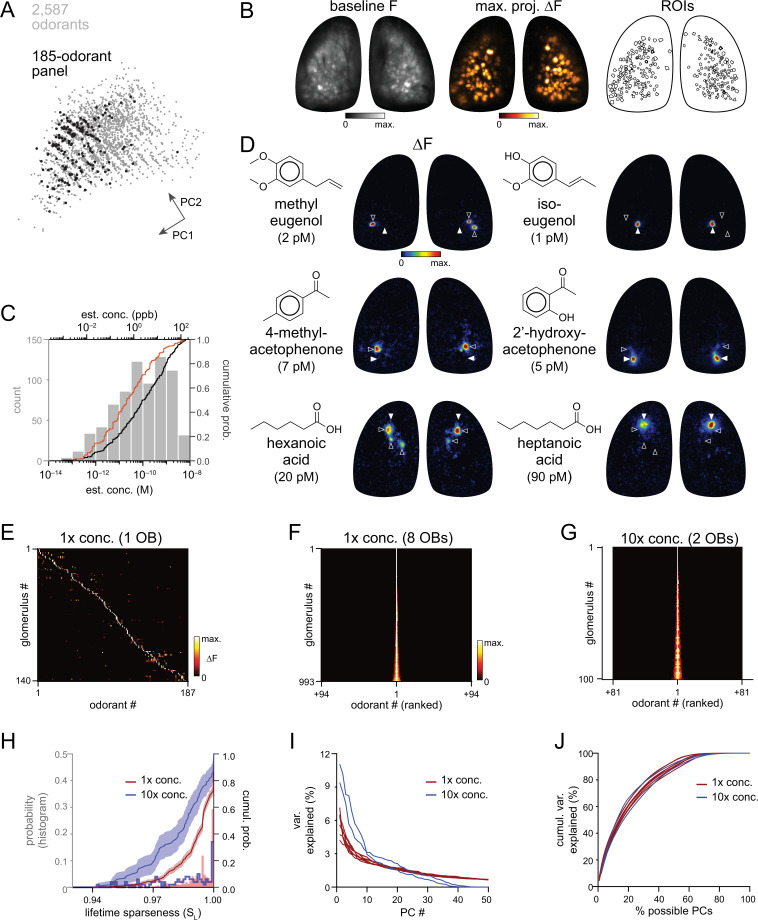
Figure 1—source data 1. Source data for Figure 1C.
Figure 1—source data 2. Source data for Figure 1H.

Figure 1.

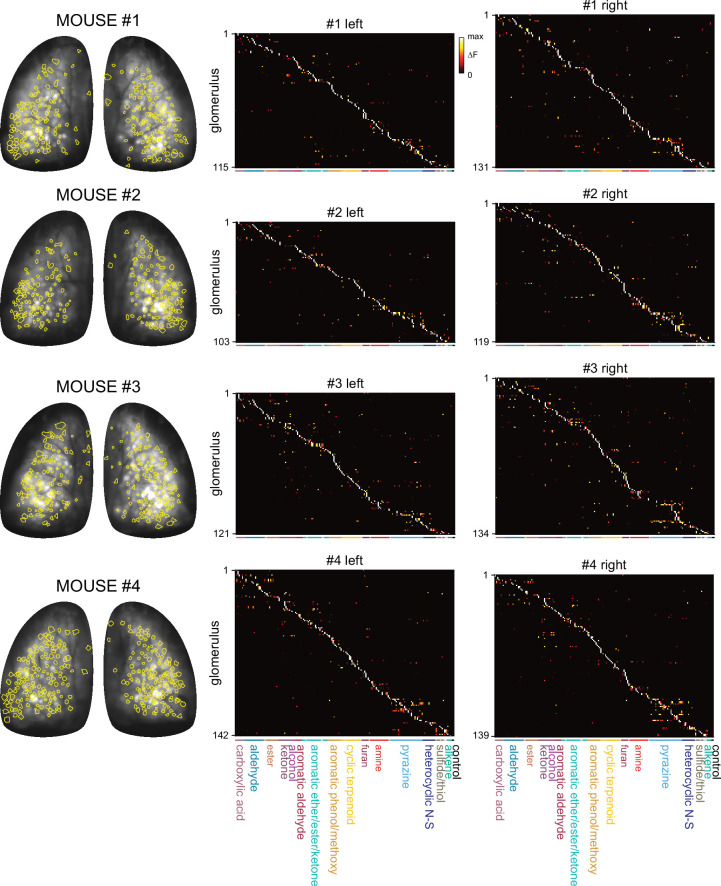
Figure 1—figure supplement 1. Summary of responsive glomeruli and their response spectra.

Figure 1—figure supplement 1.

Left: Overlay of all ROIs indicating odorant-responsive glomeruli (yellow) and baseline fluorescence for the four mice imaged under widefield epifluorescence. Right: Matrices of responses across all responsive glomeruli and odorants in each OB after manual segmentation as described (see Materials and methods). Glomeruli and odorants are sorted as in Figure 1E and odorants occur in the same order as in Supplementary file 1. Naming and color-coding of odorant structural classes matches those in Figures 4 and 5.
Figure 1—figure supplement 1—source data 1. Source data for Figure 1—figure supplement 1.
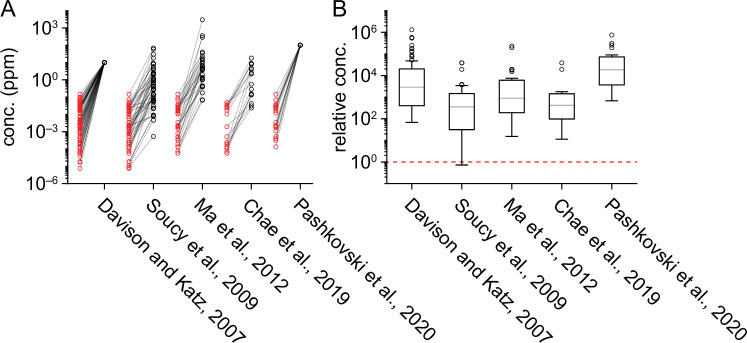
Figure 1—figure supplement 2. Comparison of delivered odorant concentrations across studies.

Figure 1—figure supplement 2.

(A) Pairwise comparison of delivered odorant concentrations in the current study (red circles) vs. select previous studies (black circles). Only odorants common across each pair of studies are plotted, with lines connecting concentrations of the same odorant. (B) Distribution of the delivered concentration of each odorant in previous studies relative to the concentration of the same odorant used in the current study. Numbers of odorants plotted is equal to the number of data points shown in (A). Dashed red line marks equal concentrations across the previous and current study. Boxes show median and interquartile range; whiskers delimit the most extreme values not considered outliers, as defined by the ‘boxplot’ function in Matlab. Both absolute (A) and relative (B) odorant concentrations are shown on a log-scale.
Figure 1—figure supplement 2—source data 1. Source data for Figure 1—figure supplement 2.
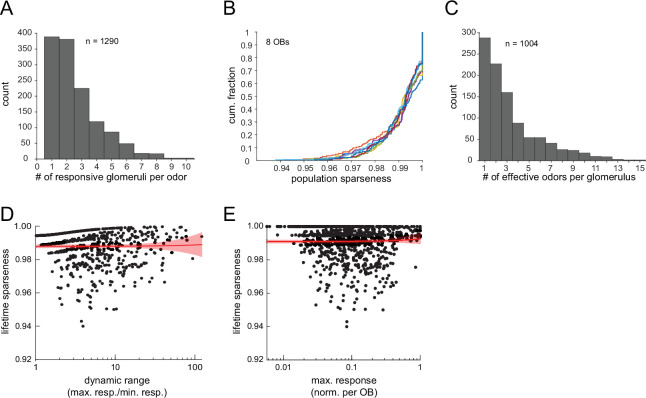
Figure 1—figure supplement 3. Sparse glomerular responses evoked across the 185-odorant panel.

Figure 1—figure supplement 3.

(A) Histogram of number of glomeruli activated by a given odorant presentation, excluding non-responsive presentations (n=1290, 8 OBs imaged under widefield epifluorescence). (B) Cumulative distribution function of population sparseness (SP) for each odorant, plotted separately for each of the eight OBs. SP of 1 indicates a single responsive glomerulus. (C) Distribution of the number of effective odorants for each of 1004 glomeruli across the eight OBs. (D) Lifetime sparseness (SL) of glomerular tuning across the 185-odorant panel, plotted as a function of dynamic range for all glomeruli responding to more than one odorant (n=716 glomeruli). Dynamic range is conservatively defined as the ratio between the maximal response and the minimal non-zero odorant response. Red plot shows linear regression to data, with 95% confidence interval. Slope is not significantly different from 0 (linear regression t-test: p=0.89, t714=0.14). (E) SL as a function of maximal response amplitude for all imaged glomeruli (n=1004). Responses normalized to the maximal response in a given OB. Red plot shows linear regression to data, as in (D). Slope is not significantly different from 0 (linear regression t-test: p=0.42, t1002=0.81).
Figure 1—figure supplement 3—source data 1. Source data for Figure 1—figure supplement 3.
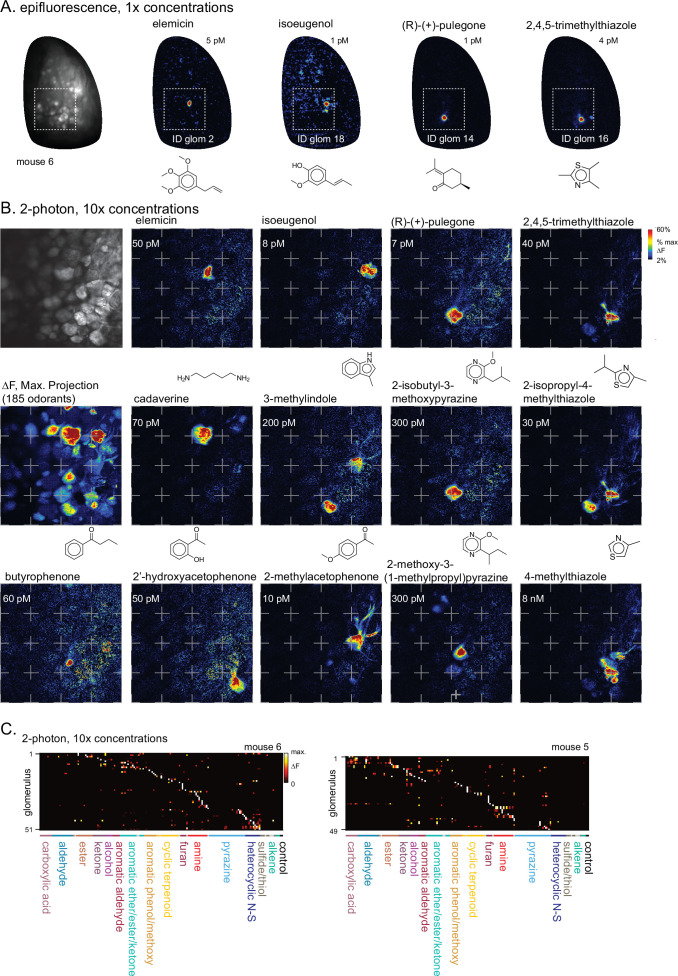
Figure 1—figure supplement 4. Two-photon imaging of glomerular odorant responses to tenfold higher odorant concentrations.

Figure 1—figure supplement 4.

(A) Epifluorescence response maps to 1 x concentrations of diagnostic odorants for functionally-identified glomeruli, imaged across one OB (new mouse, ‘mouse #6’). (B) Higher magnification two-photon imaging of the boxed area in (A) using 10 x odorant concentrations. Upper left, baseline fluorescence of glomerular imaging field. Response maps (ΔF) show activation of specific glomeruli by select odorants. Dashed grid lines added to facilitate visual inspection across maps. (C) Left: Response matrix for glomeruli imaged in (B), showing responses to the 10 x concentration odorant panel for mouse #6. Only responses to odorants tested at 10 x concentration (plus blank and solvent controls) are shown. Glomeruli are sorted in order of their maximally-activating odorant, producing a pseudo-diagonalized matrix, as in Figure 1E. Right: Response matrix for the same 10 x odorant panel imaged in a second mouse (mouse #5).