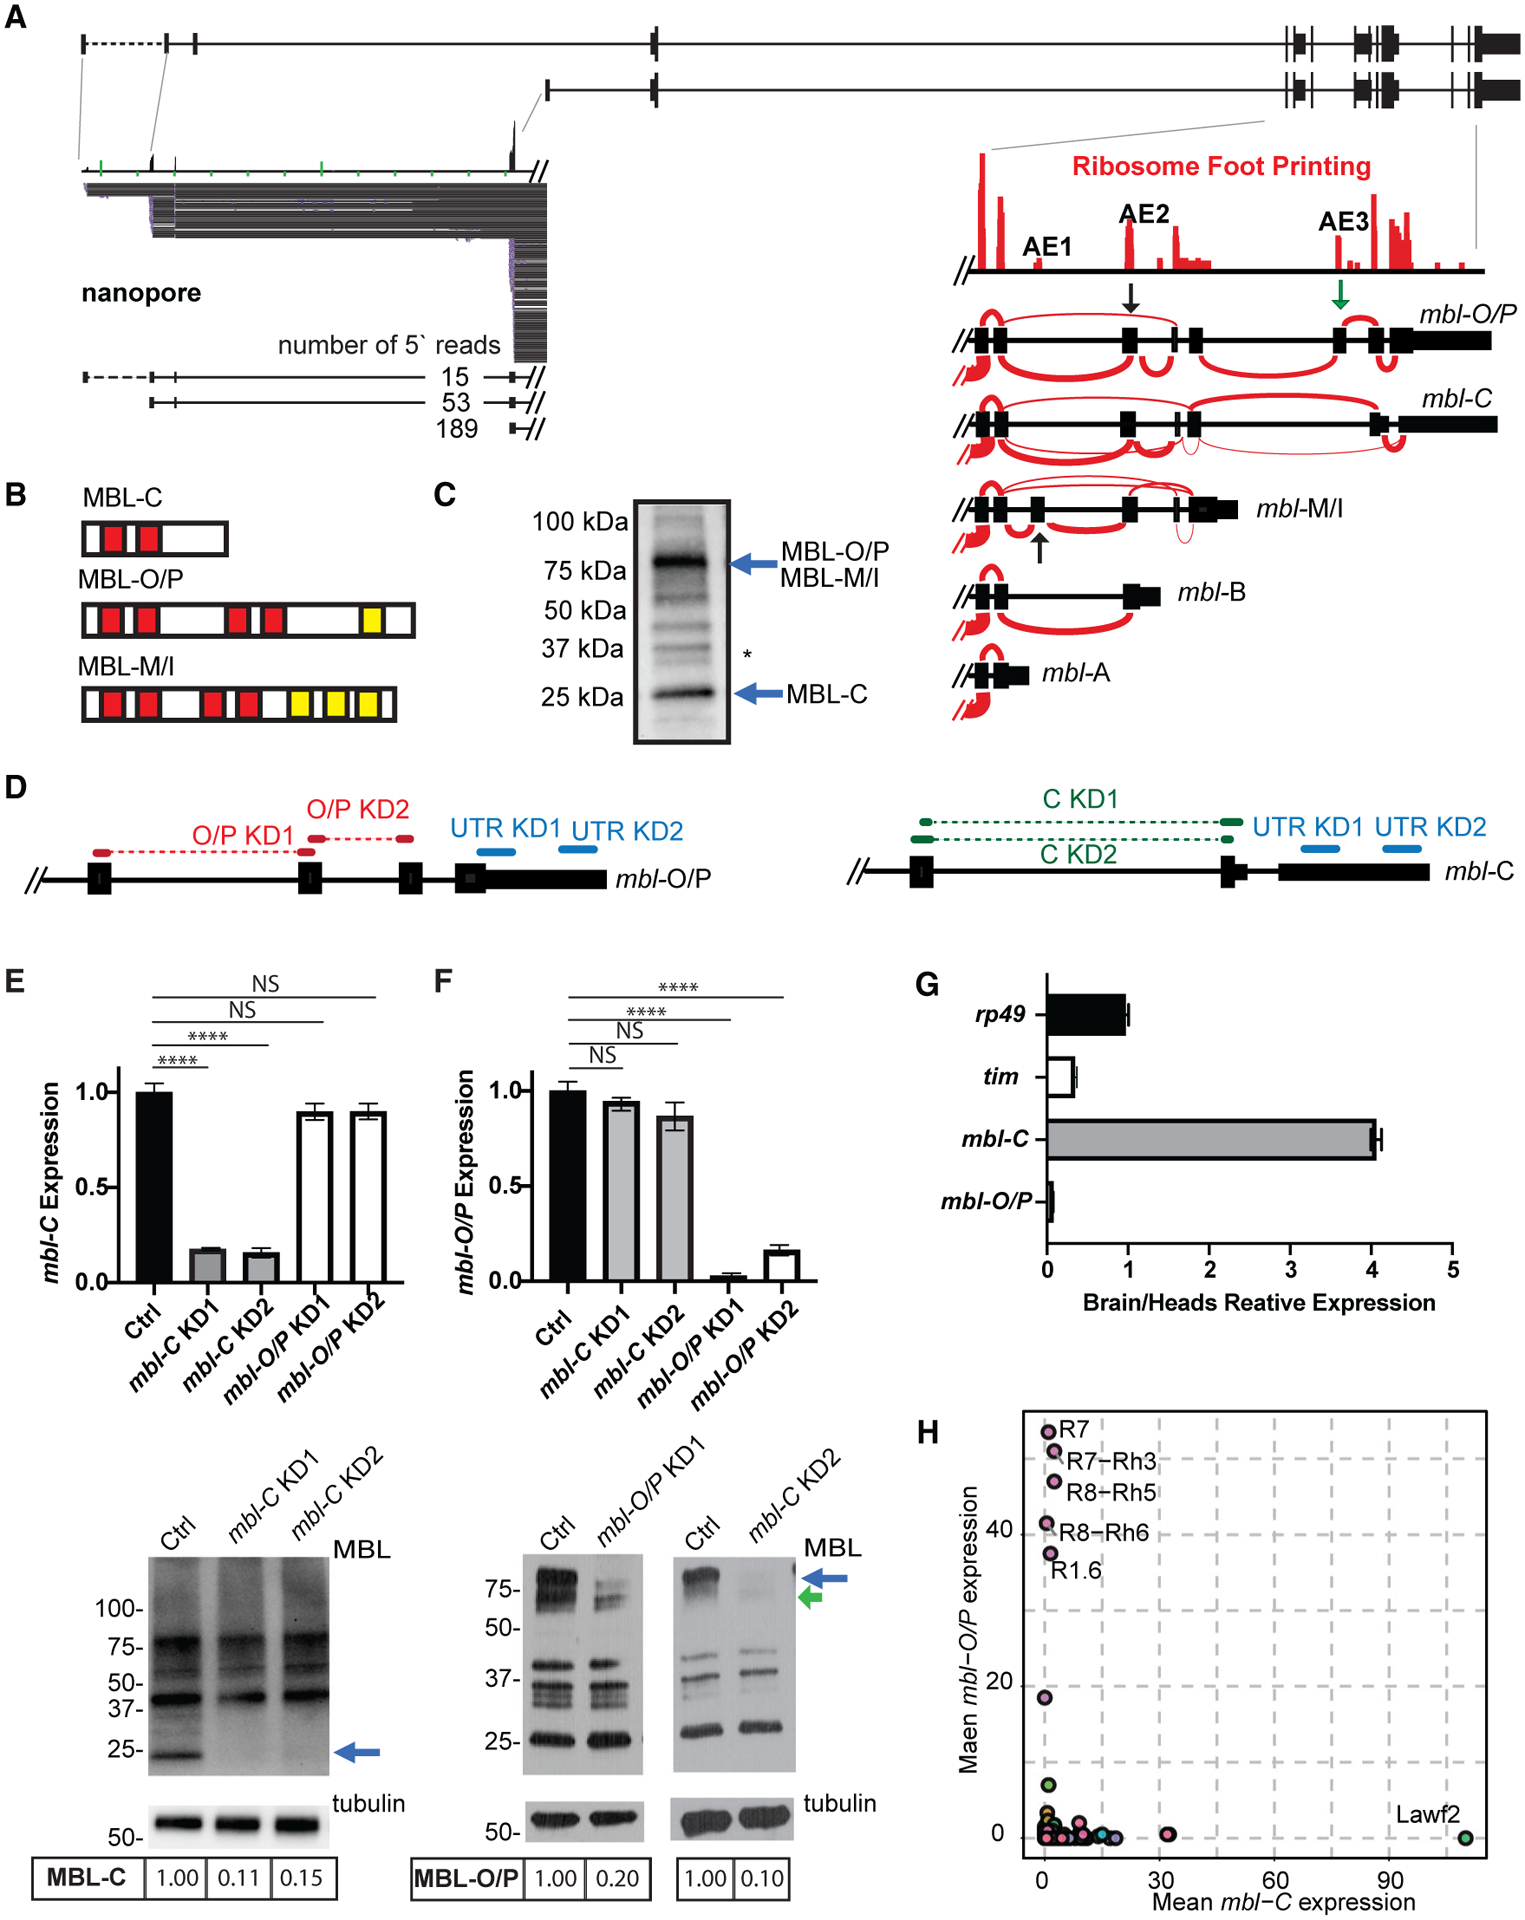
Figure 1. The mbl locus generates several RNA and protein isoforms.

(A) Upper: schematic representation of mbl locus. Bottom left: nanopore RNA-seq reads from three distinct promoter regions. Bottom right: ribosome footprinting data. Sashimi plots show the different mbl isoforms 3′ annotation.
(B) Scheme of the protein domains in the different MBL isoforms. Red boxes indicate zinc fingers. Yellow boxes indicate intrinsically disordered regions.
(C) Western blot showing MBL-C and MBL-O/P protein isoforms (blue arrows); membrane was blotted using anti-MBL. Asterisk denotes non-specific band (based on the fact that none of the shRNAs or the available KK RNAi line affected the band consistently and that the band is not labeled when performing a western blot in an endogenously FLAG-tag MBL fly [Michela Zaffagni, personal communication]).
(D) shRNAs used to knock down mbl-C and mbl-O/P isoforms either independently or together.
(E and F). qRT-PCR (top) and western blot (bottom) from heads of KD for mbl-C (E) or mbl-O/P (F) isoform. Arrow indicates the MBL-C or MBL-O/P bands.
(G) qRT-PCR of rp49, tim, and mbl isoform expression levels in fly brain and heads.
(H) mbl-C and mbl-O/P mean expression in total RNA-seq data from sorted cells (n = 2, data from Davis et al., 2020). Each circle represents a cell type.
In all qRT-PCR analyses, tubulin was used as normalization control (n = 3, standard error of the mean [SEM], two-tailed t test performed for significant difference: ****p < 0.0001, ***p < 0.0002, **p < 0.0021, *p < 0.0332). In all western blot images, the quantification of MBL isoforms is stated below the images.
