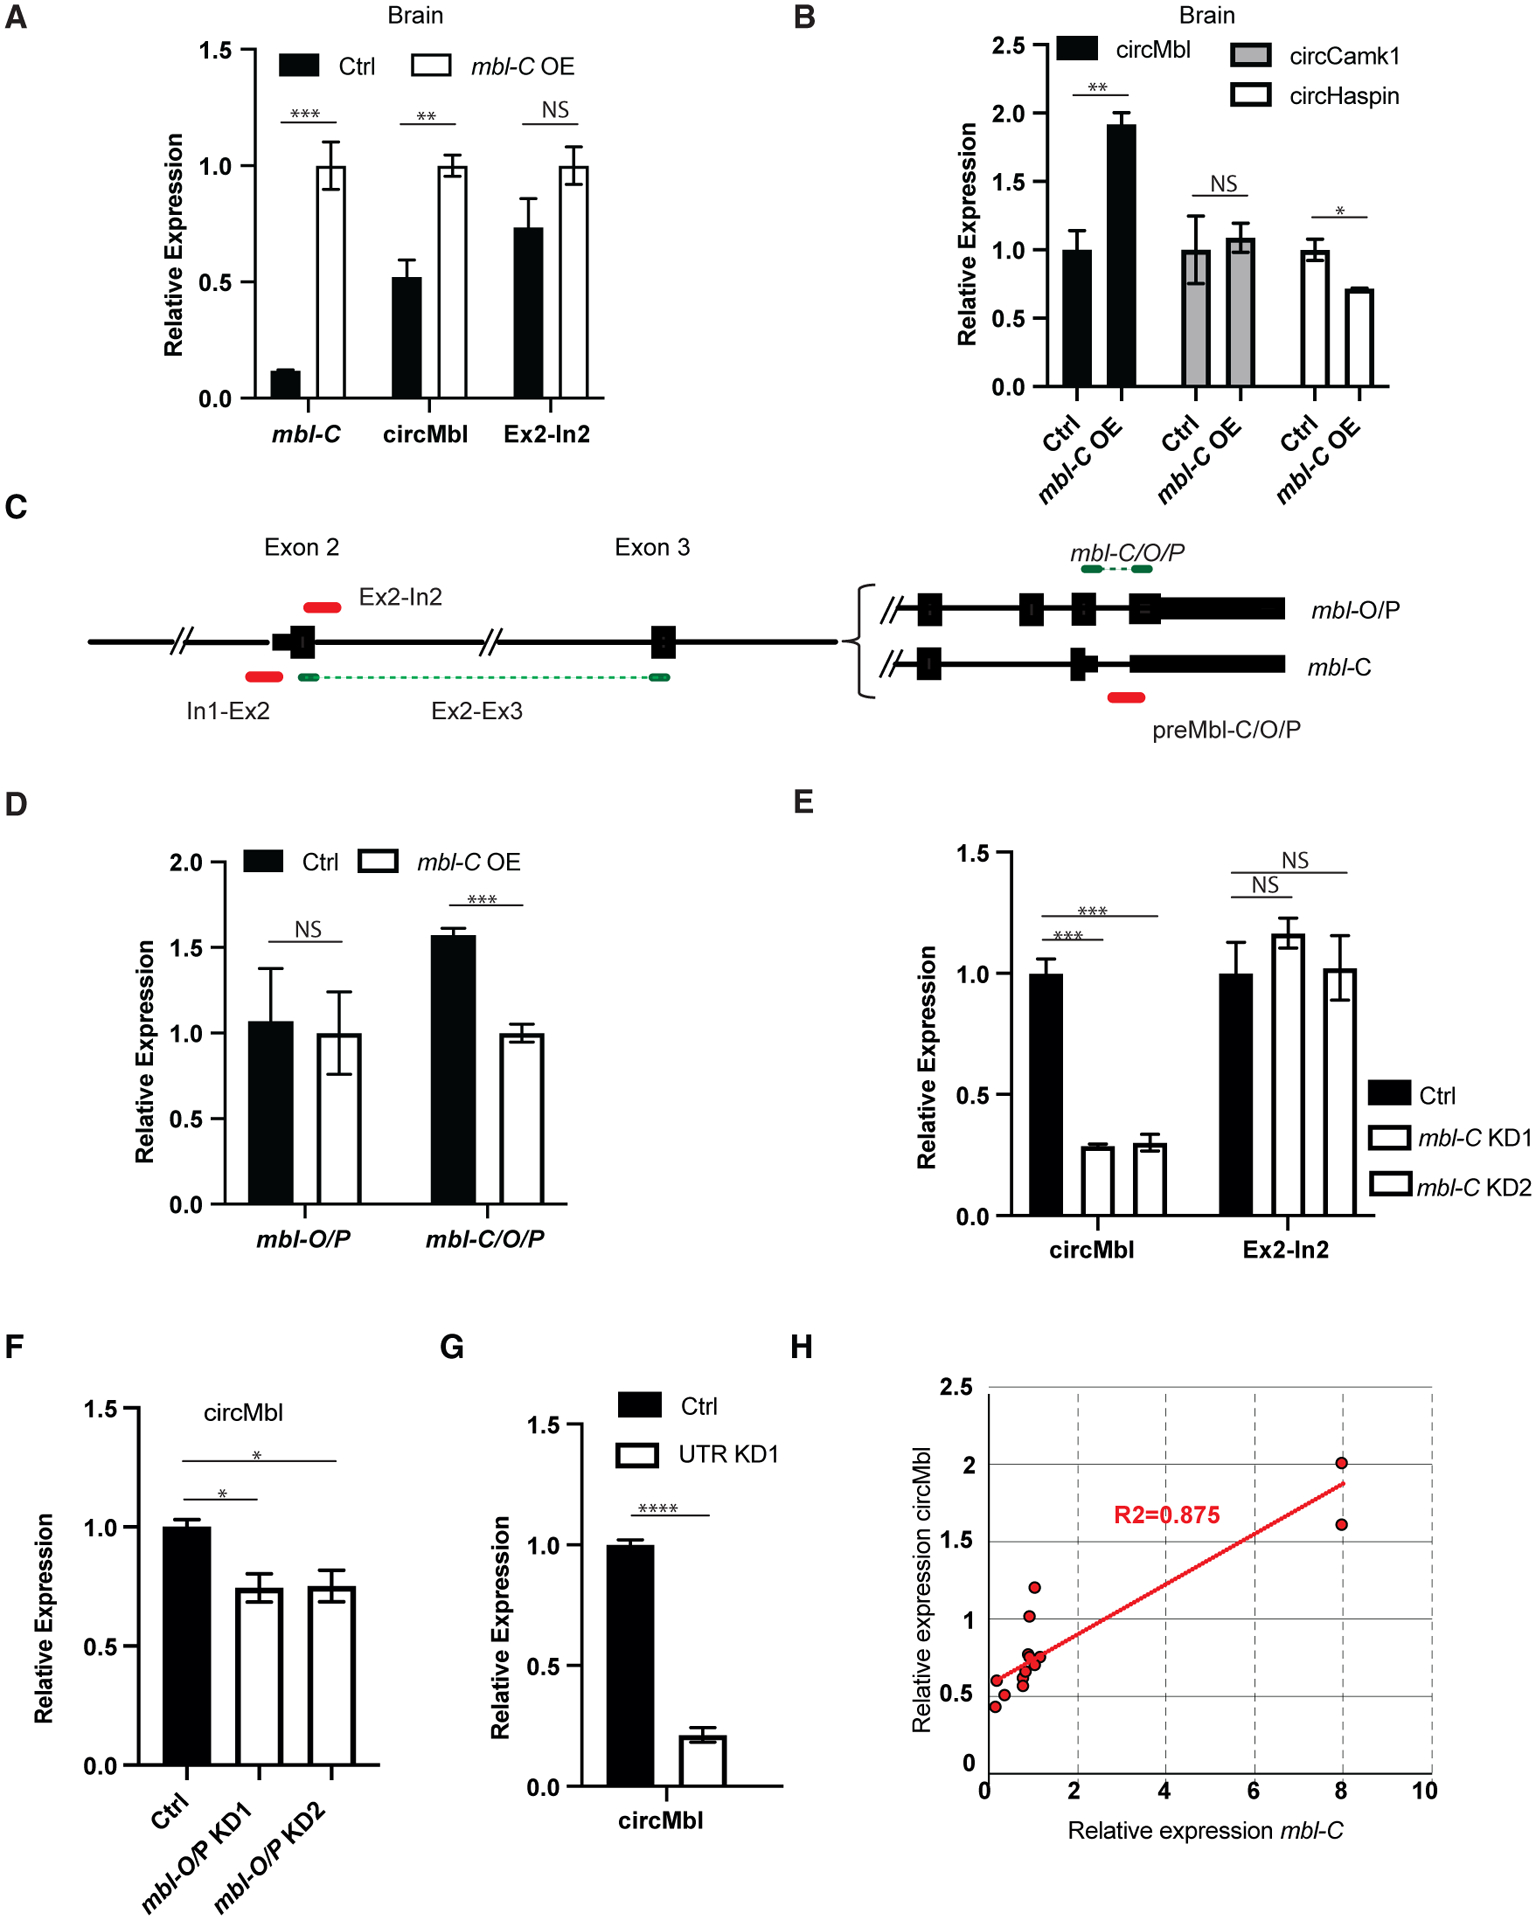
Figure 3. mbl-C and circMbl regulate each other in cis.

(A and B) qRT-PCR of the indicated targets in mbl-C-OE fly brains.
(C) Scheme of the primer sets used to quantify the mbl locus expression.
(D) qRT-PCR of mbl-O/P and mbl-C/O/P in mbl-C-OE fly brain.
(E) qRT-PCR of the indicated targets in mbl-C-KD fly heads.
(F and G) qRT-PCR of circMbl in heads of mbl-O/P (F) and UTR-KD flies (G).
(H) mbl-C and circMbl expression levels correlation plot in various mbl isoform KD flies.
In all cases tubulin was used as a normalization control (n = 3, error bars represent SEM, two-tailed t test performed for significant difference: ****p < 0.0001, ***p < 0.0002, **p < 0.0021, *p < 0.0332).
