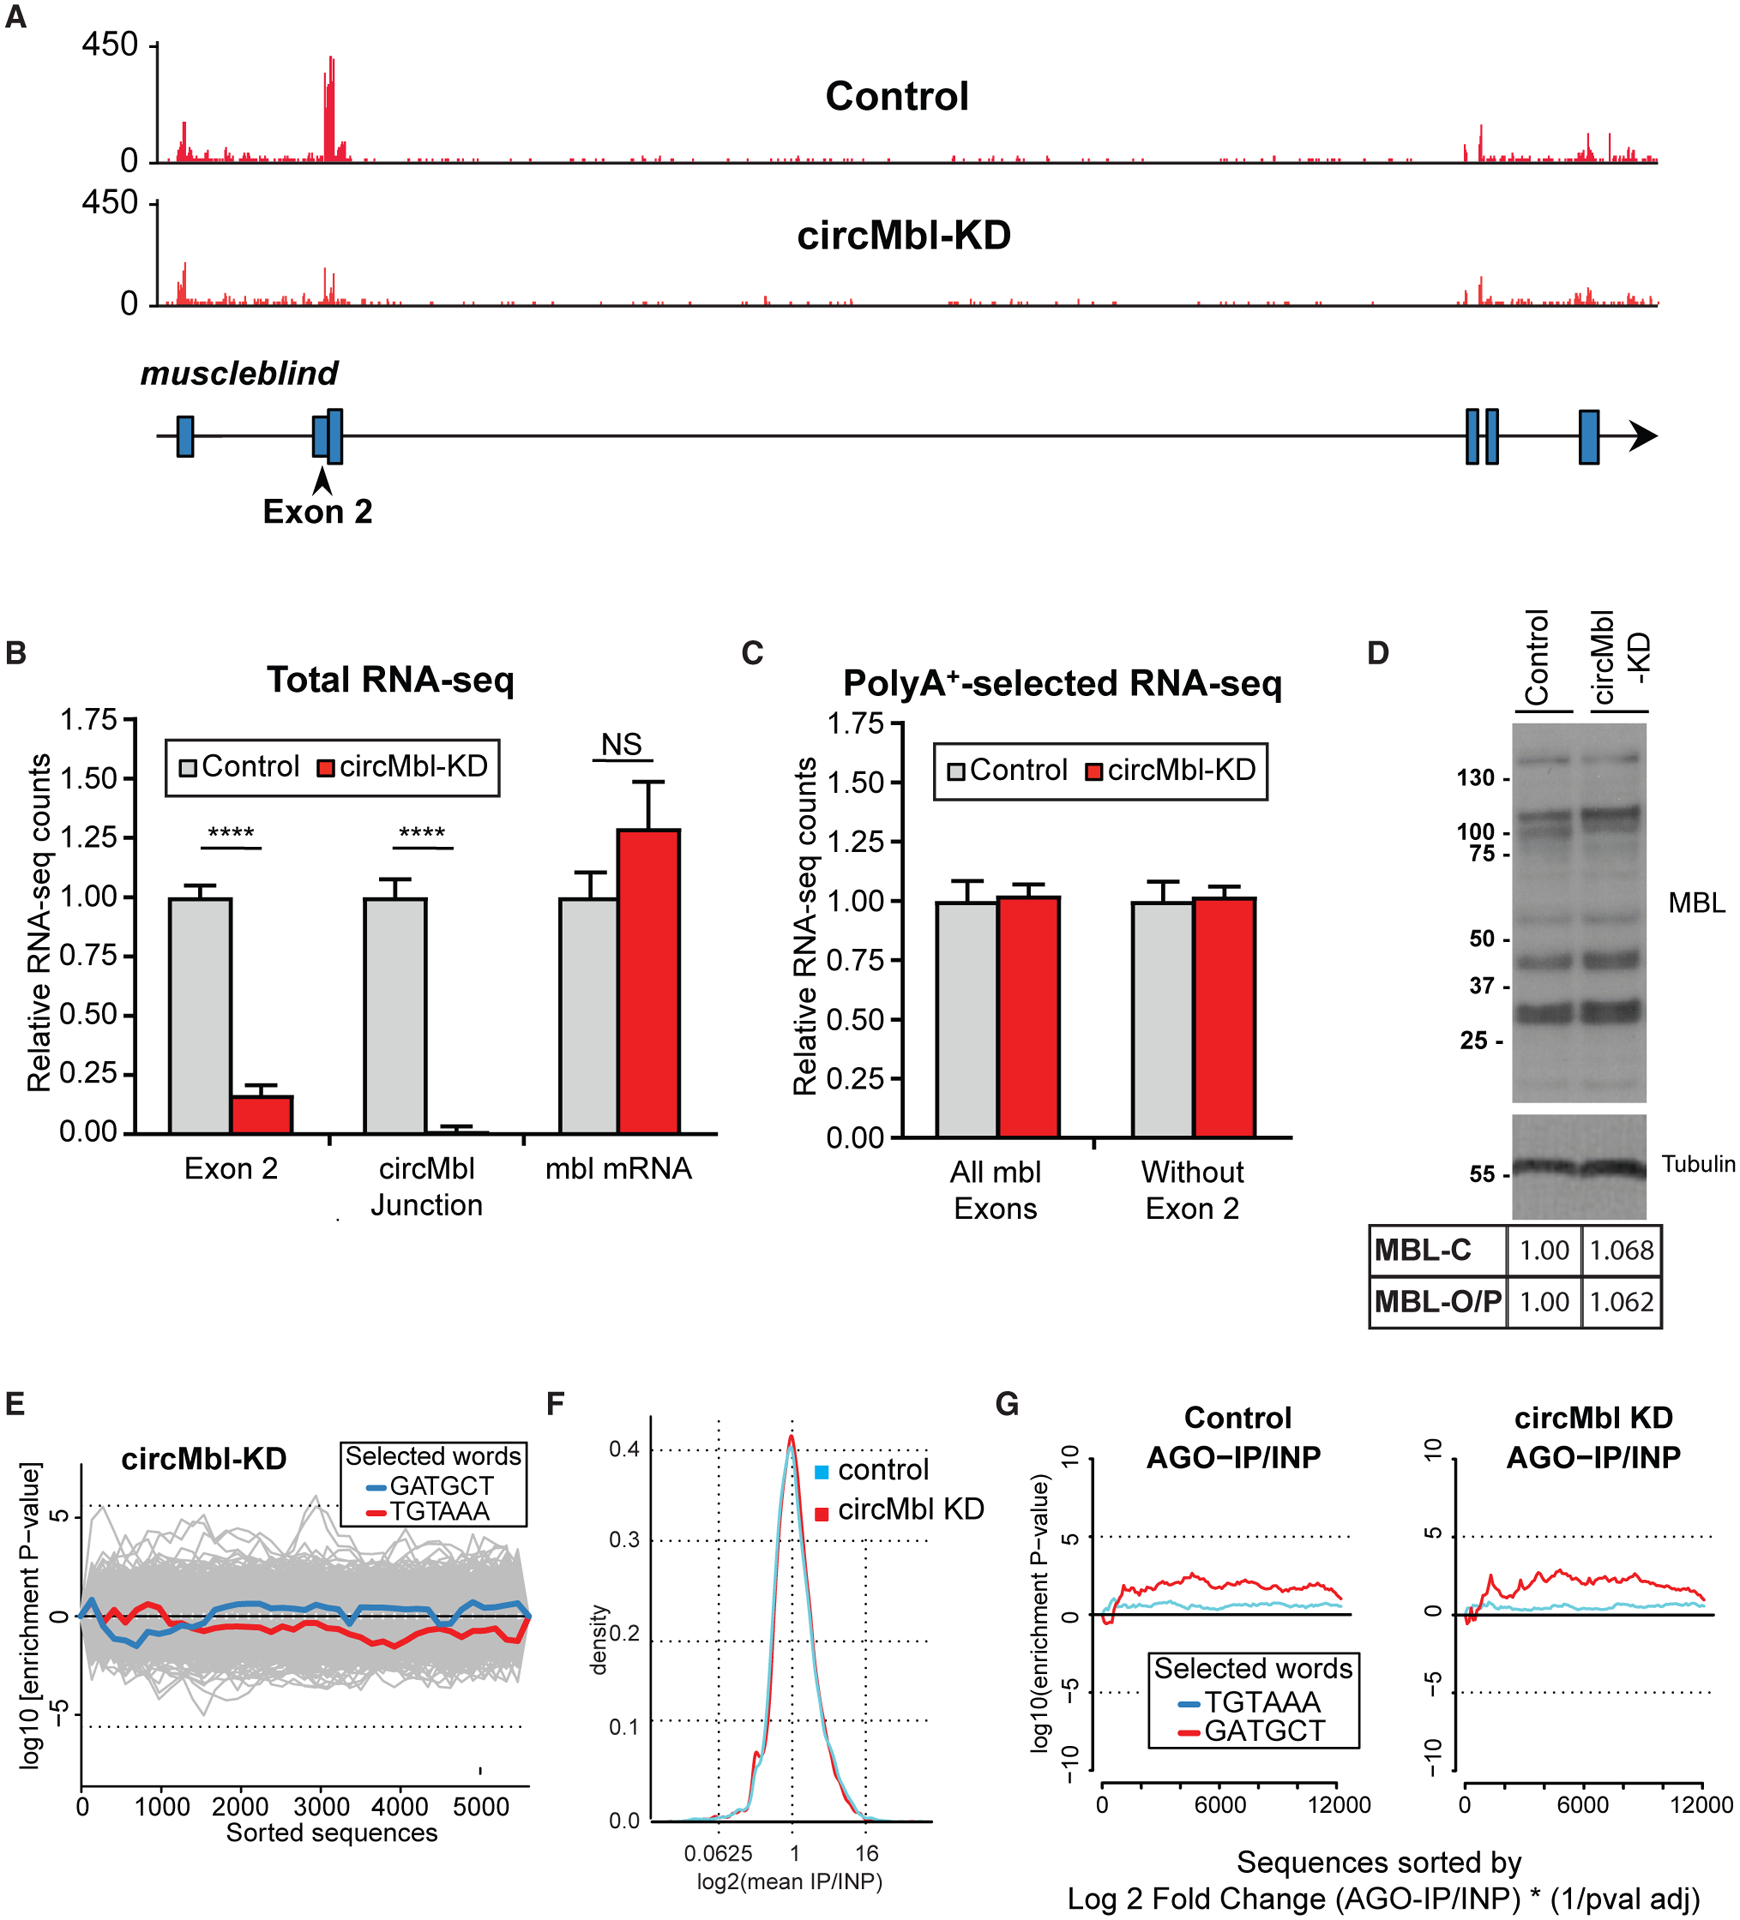
Figure 5. circMbl can be specifically downregulated in vivo.

(A) IGV snapshot, showing a specific reduction of exon 2 in respect to a control strain.
(B and C) Quantification of the indicated mbl regions from total (B) and poly(A+) (C) RNA-seq data (n = 3, error bars represent SEM, two-tailed t test performed for significant difference: ****p < 0.0001, ***p < 0.0002, **p < 0.0021, *p < 0.0332).
(D) Western blot of control and circMbl-KD flies using anti-MBL immunosera.
(E) Assessment of off-targets by Sylamer. Traces show the seed enrichment for the genes differentially expressed upon downregulation of circMbl. shRNA and shRNA* seed sequences shown in blue and red, respectively.
(F) General binding of mRNAs to AGO1 in shRNA and control line.
(G) Sylamer enrichment landscape plot for sh-circMbl and sh-circMbl* 6-mers. The x axis represents the genes sorted from the most to the least enriched in the AGO1 immunoprecipitation (IP) sequencing. INP, input.
