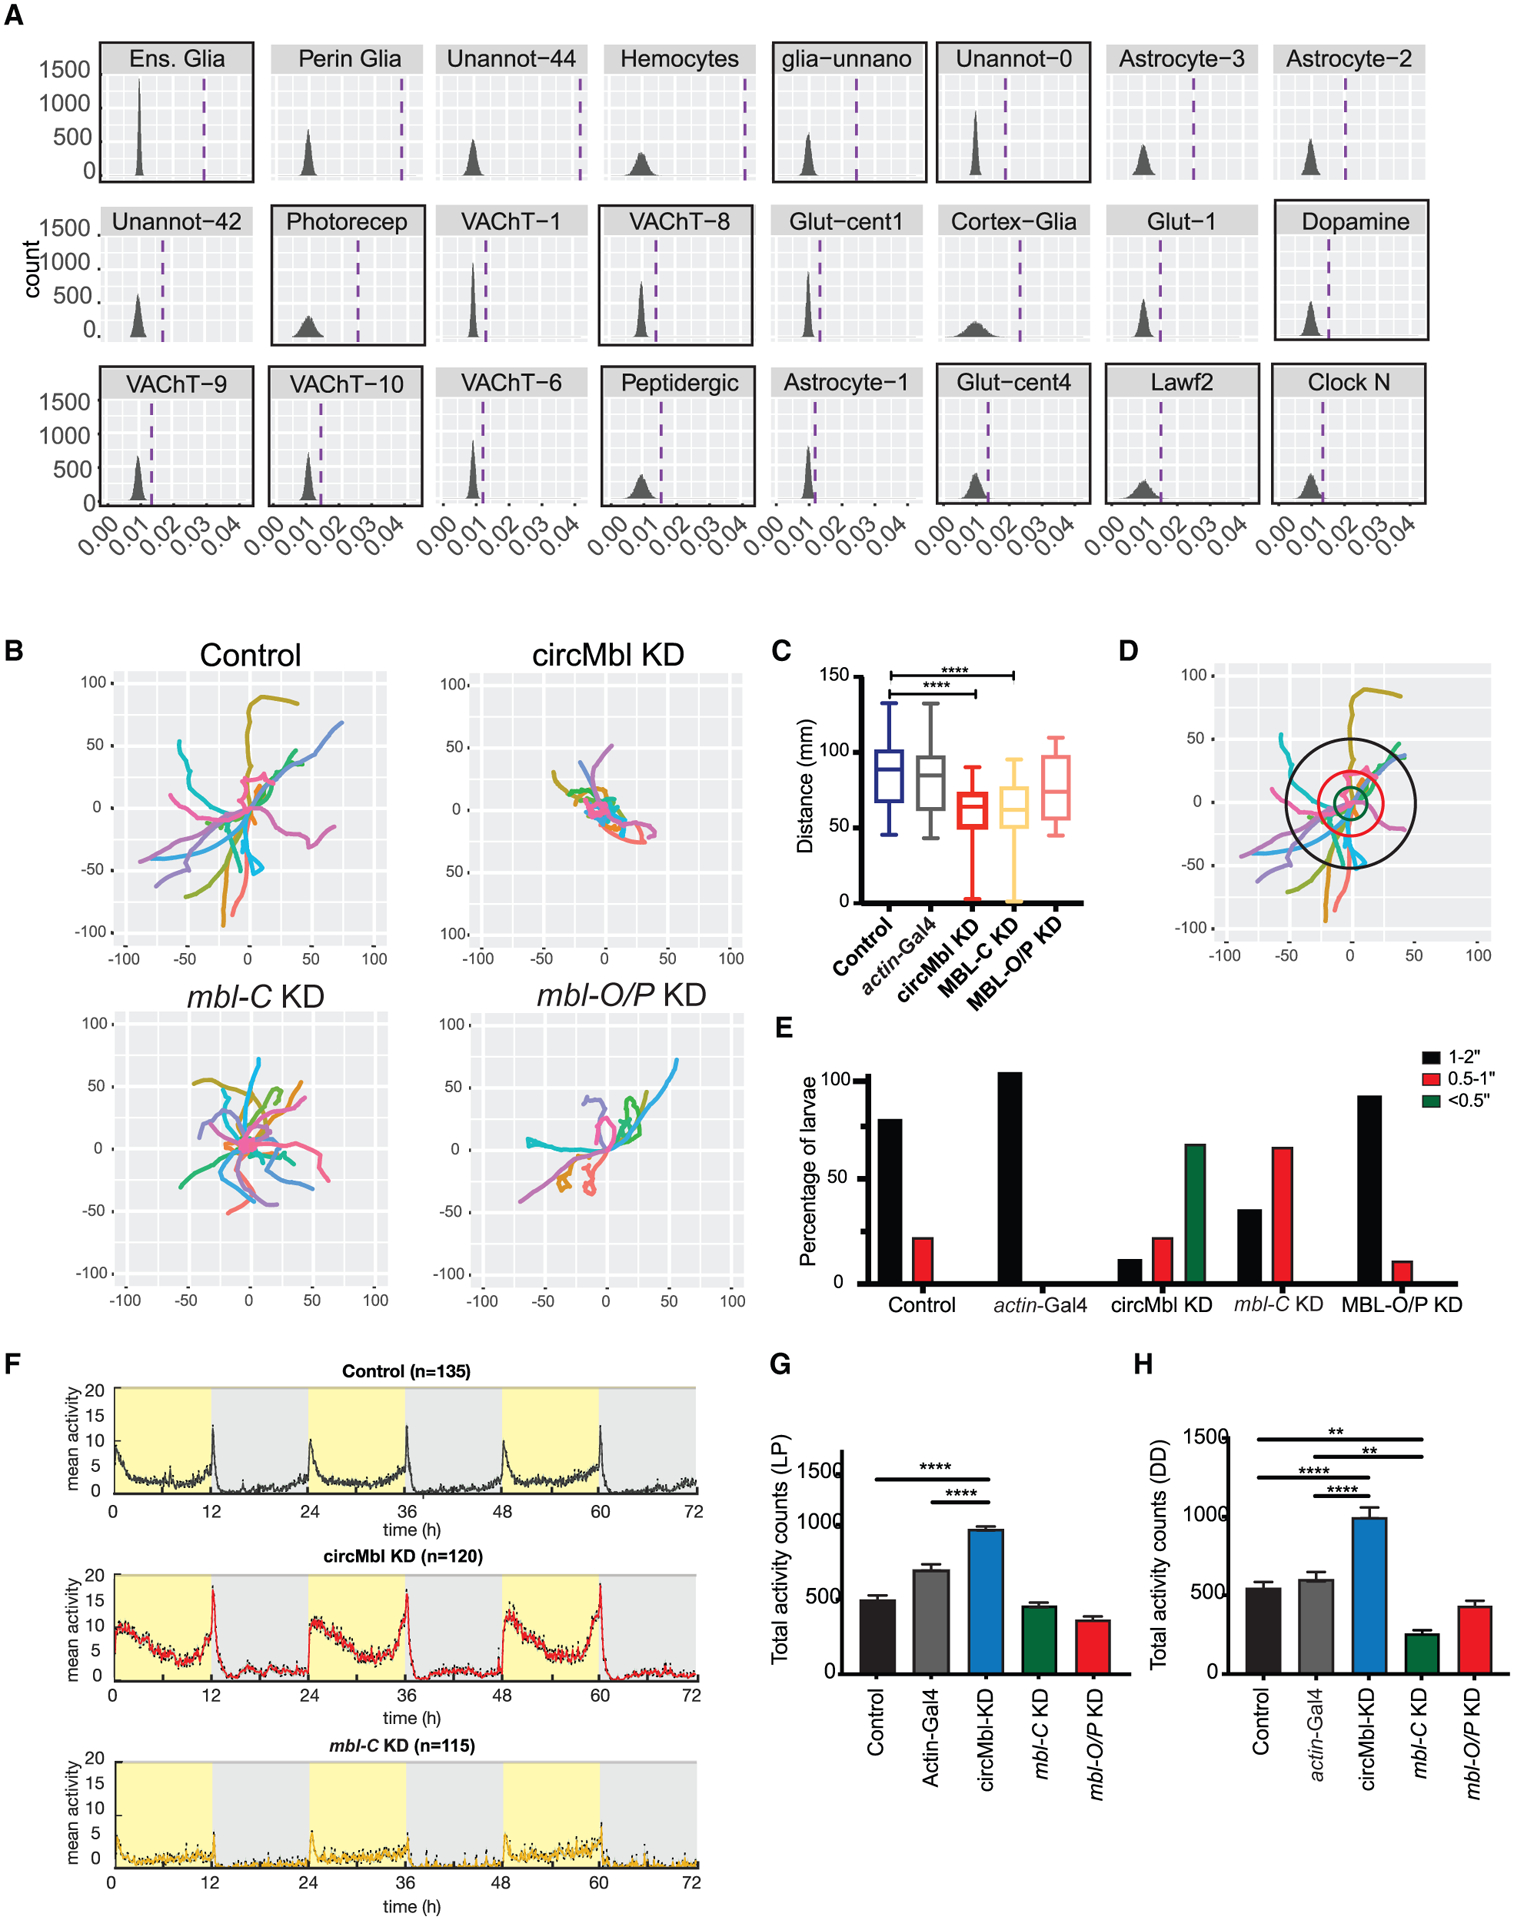
Figure 7. Knockdown of circMbl and MBL-C results in locomotor defects.

(A) Single-cell clusters with significant enrichment for genes differentially expressed in circMbl-KD brains. Dashed lines denote mean gene set enrichment in each cluster. Clusters with high levels of circMbl are highlighted with black squares.
(B) Path covered in larval assay for the indicated flies.
(C) Total distance (mm) traveled by each larva (three independent replicas, control n = 32, circMbl-KD n = 26, MBL-C-KD n = 32, MBL-O/P-KD n = 32). Boxplot shows mean, interquartile, and extreme values (two-tailed t test performed for significant difference: ****p < 0.0001, ***p < 0.0002, **p < 0.0021, *p < 0.0332).
(D) Representation of the analysis of the movement of control (8MM) larvae. The concentric circles are at distance of <0.5 inch (green), 0.5–1 inch (red), and 1–2 inches (black).
(E) Percentage of larvae that cross each of the concentric circles described in (D) (three independent experiments, number of larvae per experiment >10 when possible).
(F) Average activity over 3 days in 12:12 LD at 25°C. Light phase is represented in yellow and dark phase in gray (five independent replicas, control n = 135, circMbl-KD n = 120, MBL-C-KD n = 115, MBL-O/P-KD n = 96).
(G and H) Total activity during the light period in LD (G) and total activity over 5 days in complete darkness (DD) (H). Asterisks represent statistical significance relative to 8MM and Actin-Gal4 controls calculated by one-way ANOVA and Tukey’s multiple comparisons test (****p < 0.0001, **p < 0.005).
