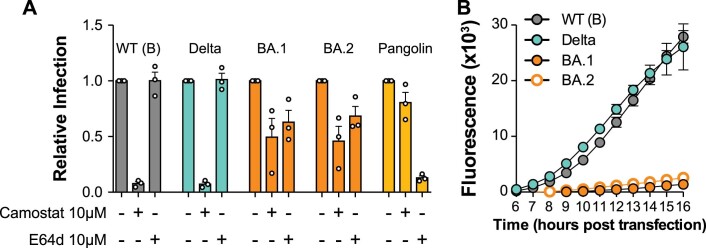
Extended Data Fig. 9. Characterisation of Omicron BA.2 spike.
a, Relative SARS-CoV-2 pseudotype infection (compared to respective untreated controls) treated with 10 μM protease inhibitors. Data represent mean of three biological repeats, error bars indicate standard error of the mean. b, cell fusion assay using cells transfected to express WT (B lineage), Delta, Omicron BA.1 and BA.2 spike, values represent mean GFP fluorescence signal from one representative experiment error bars indicate standard error of the mean (3 technical repeats, representative of 4 biological repeats).

