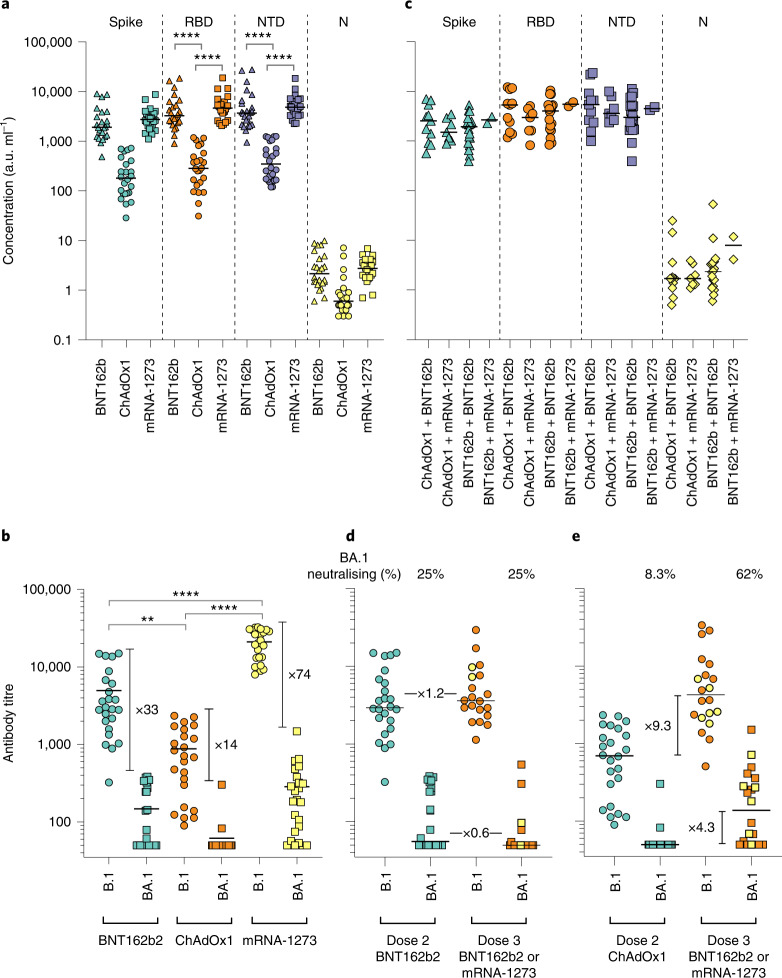
Fig. 2. Antibody responses elicited by SARS-CoV-2 vaccination.
a,b, Antibody responses were studied in three groups of individuals (n = 24 per group) receiving primary vaccination with either BNT162b2, ChAdOx1 or mRNA-1273 by MSD-ECL assay (a) or pseudotype-based neutralization assay (b). a, Responses were measured against full-length spike glycoprotein (Spike), RBD, NTD and N, and are expressed as arbitrary units (a.u. ml−1). Horizontal bar represents group mean; between group comparisons by ordinary one-way analysis of variance (ANOVA), Tukey’s multiple comparisons test; ****P < 0.0001. b, NAb responses were quantified against B.1 lineage (D614G) or Omicron (BA.1) spike glycoprotein bearing HIV (SARS-CoV-2) pseudotypes. Each point represents the mean of three replicates, horizontal bar represents the group mean; between group comparisons by ordinary one-way ANOVA, Tukey’s multiple comparisons test; **P = 0.0075, ****P < 0.0001. c–e, To assess the effect of booster vaccines, antibody responses were studied in two groups of individuals primed with two doses of either BNT162b2 or ChAdOx1 and boosted with either BNT162b2 or mRNA-1273. Reactivity against SARS-CoV-2 antigens was measured by MSD-ECL assay (c), while neutralizing activity (d,e) was measured using HIV (SARS-CoV-2) pseudotypes, as above. Yellow data points represent those boosted with mRNA-1273, all others received BNT162b2. In d and e, ‘BA.1 neutralizing (%)’ refers to the proportion of serum samples that displayed neutralizing activity against Omicron pseudotypes.

