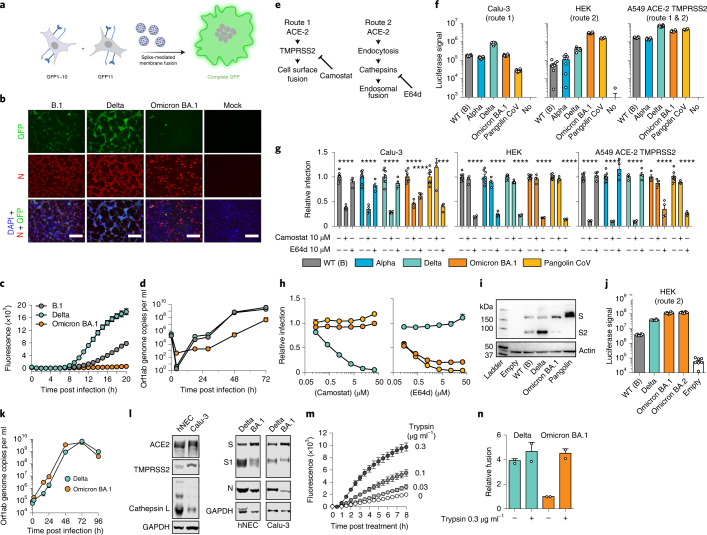
Fig. 5. Omicron exhibits reduced syncytia formation and has switched entry route.
a, Virus-induced fusion of co-cultured cells expressing split GFP (GFP-10 and GFP-11, respectively) reconstitutes fluorescence (image generated in BioRender, agreement SX23HJ6GY8SX23HJ6GY8). b, Co-cultured GFP-10 and GFP-11 A549-ACE2-TMPRSS2 cells were infected with B.1, Delta and Omicron/BA.1, photomicrographs taken at 22 h post infection: GFP, green; nucleocapsid (N), red; DAPI nuclei, blue; scale bars, 100 µm. c, Fluorescence over 20 h (n = 4 technical repeats, 3 independent experiments, 2 virus stocks). d, Calu-3 cell infection with B.1, Delta and Omicron/BA.1. Supernatants were assessed by RT-qPCR (n = 3 technical repeats, 2 independent experiments). e, SARS-CoV-2 entry routes: route 1 – fusion at the cell surface following processing by TMPRSS2; route 2 – fusion occurs post endocytosis after processing by cathepsins. Routes 1 and 2 are inhibited by Camostat and E64d, respectively. f, SARS-CoV-2 pseudotype infection of cell lines, mean luciferase values (1 experiment, n = 8 technical repeats, representative of 3 independent experiments). Route 1 predominates in Calu-3, route 2 in HEK, and both routes are supported by A549-ACE2-TMPRSS2. Control is Pangolin CoV (route 2 only), negative control is no glycoprotein pseudotypes (No). g, Relative pseudotype infection (compared to untreated) of 10 μM protease inhibitor-treated cells; mean of 4 biological repeats, ****P < 0.0001, one-way ANOVA, Dunnett’s multiple comparisons test. h, Camostat (left) and E64d (right) titration against Delta, Omicron/BA.1 and Pangolin CoV in A549-ACE2-TMPRSS2; mean relative infection compared to untreated control (n = 2 biological repeats). i, Immunoblot of spike-expressing HEK lysates with anti-spike (S2) and anti-actin. j, HEK infection by Omicron/BA.2 pseudotype; mean luciferase values (1 experiment, n = 8 technical repeats, representative of 3 independent experiments). k, hNEC infection with Delta and Omicron/BA.1 clinical isolates, supernatants assessed by RT-qPCR; mean of 2 independent biological repeats. l, Immunoblots of uninfected (left) and infected (right) hNEC and Calu-3 lysates. Immunoblots probed for ACE2, TMPRSS2, Cathepsin-L, GAPDH, Spike S1 and N. m, Cell–cell fusion (as in a) in Omicron/BA.1-transfected cells treated with trypsin. Plot displays mean fluorescence (1 experiment, 3 technical repeats, representative of 2 independent experiments). n, Cell–cell fusion in Delta or Omicron/BA.1-transfected cells, ±0.3 µg ml−1 trypsin. Data are relative to fusion by Omicron/BA.1 spike (−trypsin, 8 h), mean of 2 biological repeats. All error bars represent s.e.m.

