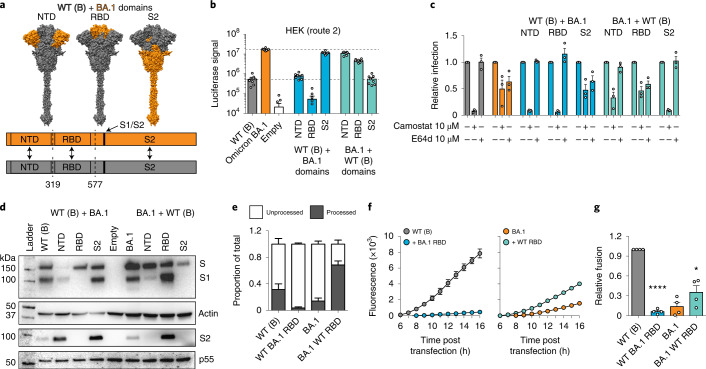
Fig. 6. Determinants of Omicron spike biology.
a, Top: schematic representation of domain swap constructs between WT (lineage B) and Omicron spike. Bottom: linear representation illustrates the junction points between the chimeric proteins. b, Domain swap pseudotype infection of HEK cells. Data represent mean luciferase values from a representative experiment (n = 8 technical repeats, data are representative of 3 independent experiments). c, Sensitivity of domain swap pseudotypes to camostat and E64d in A549-ACE2-TMPRSS2 cells. Data are expressed relative to the untreated control for each virus. Values represent the mean of 3 biological repeats. d, Immunoblot analyses of lysates from HEK cells producing domain swap pseudotypes. Blots were probed for spike (S1 and processed S2), actin loading control and HIV Gag p55 transfection control. The actin control relates to the S1 blot, while the p55 control relates to the processed S2 blot. e, Quantification of spike proteolytic processing in WT (lineage B), Omicron BA.1 and the reciprocal RBD swaps. Data are expressed relative to the total for a given spike and represent the mean of 5 independent blots. f, Cell fusion assay using cells transfected with WT (lineage B) (left), Omicron BA.1 (right) and the reciprocal RBD swap spikes. Plot displays mean GFP fluorescence signal from 1 representative experiment. g, Cell–cell fusion (as in f). Data are expressed relative to fusion by WT (lineage B) spike (at 16 h) and are the mean of 4 independent experiments. One-way ANOVA, *P < 0.01, ****P < 0.0001. In all plots, error bars represent s.e.m.

