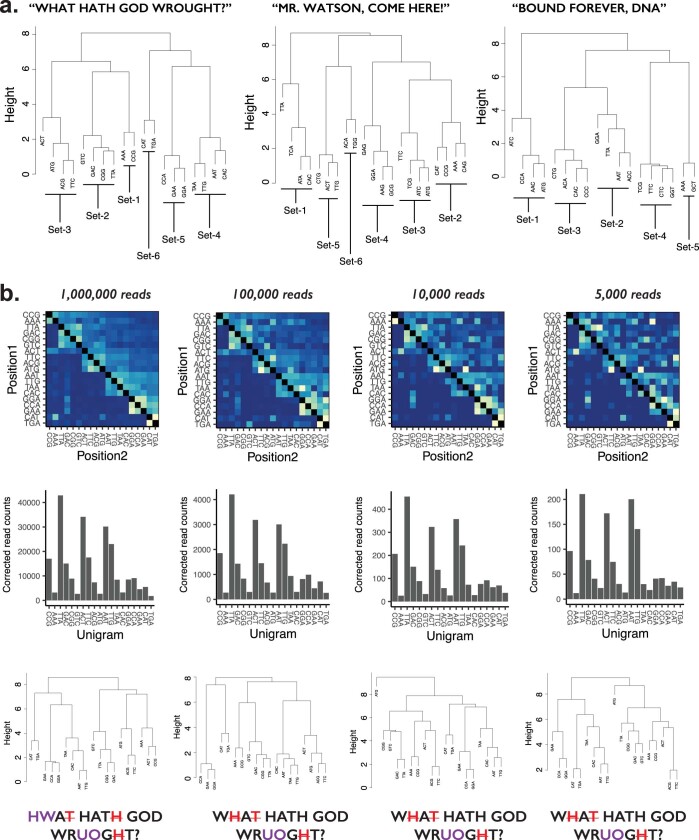
Extended Data Fig. 5. Inferring the barcode overlap in each message.
a. Hierarchical clustering analyses of identified unigram barcodes based on the bigram matrices. For each message, the normalised bigram matrix was converted to a distance matrix using the euclidean distance measure. The resulting distance matrix was then used for clustering 3-mer barcodes using the complete-linkage clustering method, resulting in a cluster dendrogram for each message. Based on these dendrograms, groups of 2 to 4 barcodes were manually grouped as putative co-transfection sets, and ordered within the set based on unigram frequencies. Sets were ordered relative to one another using the normalised bigram matrix, following the sorting algorithm described in the text. b. Undersampling analysis of the short text “WHAT HATH GOD WROUGHT?”. From the original 1,256,996 sequencing reads, we undersampled to 4 sampling points: 1,000,000, 100,000, 10,000, and 5,000 reads. For each sampling point, the bigram transition matrix (top), the corrected unigram counts (middle), and the hierarchical clustering (bottom) were plotted. From these, the original short text was inferred at the end. Both 2D histogram and corrected read counts are calculated by summing the sequencing reads over n = 3 independent transfection experiments. Read counts are corrected using the edit score for each insertion barcode.

