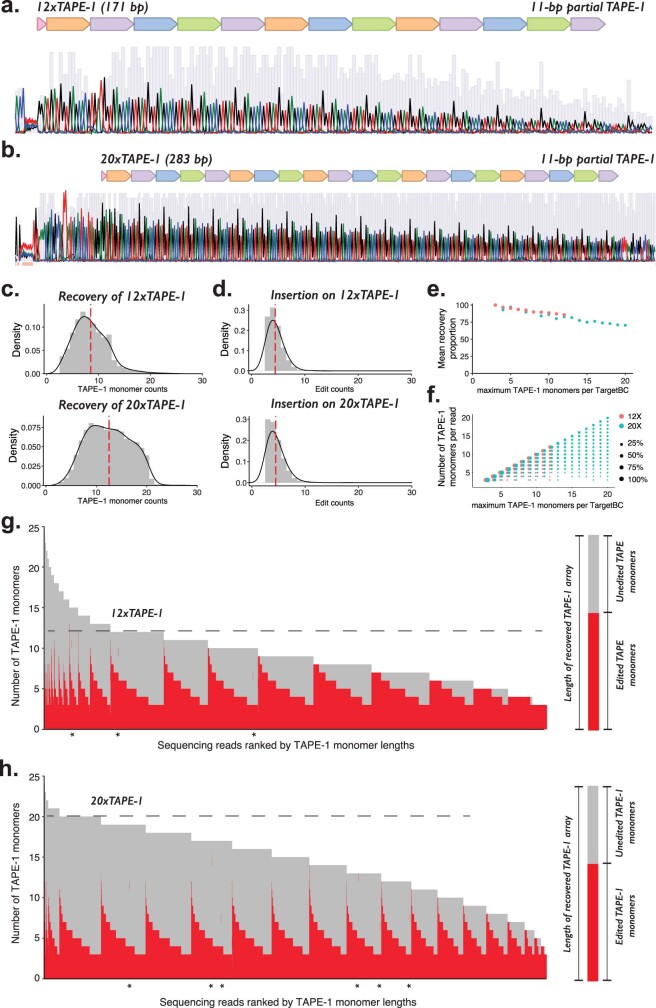
Extended Data Fig. 7. Editing and recovering longer TAPE arrays.
a-b. Sanger sequencing traces for cloned (a) 12xTAPE-1 and (b) 20xTAPE-1 constructs. Each TAPE-array includes the 3-bp key sequence (GGA for TAPE-1), 12 or 20 repeats of 14-bp TAPE-1 monomer, and a 11-bp partial TAPE-1 monomer to serve as a prime-editing homology sequence for the last editing site. Nucleotides A, C, G, and T, in Sanger sequencing traces are colored green, blue, black, and red, respectively. Grey bars in the background are proportional to quality (Phred-scale) for each base call. c-h. Integration, editing, and recovery of 12x and 20xTAPE-1 arrays. Each construct was integrated into PE2(+) 3N-TAPE-1-pegRNA(+) HEK293T cell line in triplicate, cultured for 40 days for prolonged editing, and recovered via PCR and long-read sequencing on the PacBio platform. Circular consensus sequencing (CCS) reads that had at least 3 NNNGGA insertions and no small indel errors were grouped based on the site of integration (using 8-bp TargetBC barcodes), and a read with the maximum number of TAPE-1 monomers (and within that set, the read with the maximum number of edits) was selected per TargetBC. c. Histogram of the number of TAPE-1 monomers recovered from ~12xTAPE-1 (top) and ~20xTAPE-1 (bottom) integrants. d. Histogram of number of edits recovered from ~12xTAPE-1 (top) and ~20xTAPE-1 (bottom) integrants. e. For TargetBC groups with a given maximum number of TAPE-1 monomers (X-axis), we show the mean proportion with the same number of monomers as the maximum (Y-axis), for both 12xTAPE-1 (red) and 20xTAPE-1 (blue) integrants. We conclude from this that shorter arrays are more stable, and that the length-dependent stability is consistent between the two experiments. f. Similar to (e), but showing the full distribution of monomer lengths (Y-axis) for each TargetBC group with a given maximum number of TAPE-1 monomers (X-axis), for both ~12xTAPE-1 (red) and ~20xTAPE-1 (blue) integrants. The size of dots are proportional to these proportions. Data shown in panels (c) to (f) are generated by combining sequencing reads from n = 3 transfection replicate experiments. g,h. Recovery of (g) ~12x-TAPE-1 and (h) ~20x-TAPE-1 arrays after prolonged editing. Edited portions of each TAPE-array are colored red and overwhelmingly exhibit sequential editing. Very rarely, we observe instances of non-sequential editing, e.g. internal monomers that are edited. These are marked with asterisks below the corresponding column.

