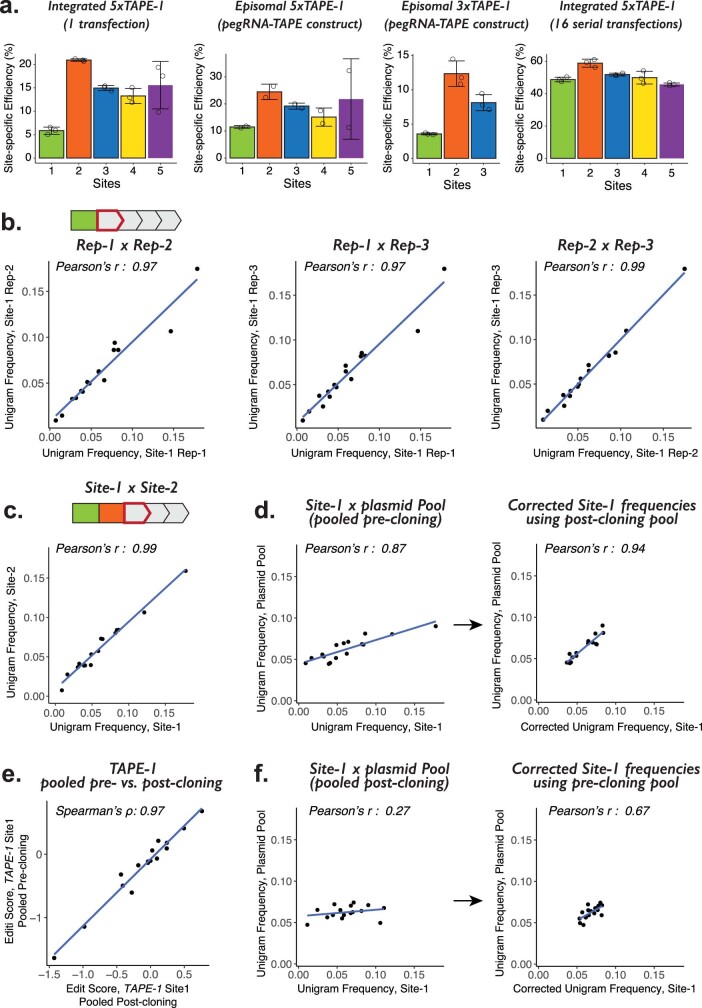
Extended Data Fig. 1. The relative insertional frequencies of k-mers to DNA Tape are determined by relative pegRNA abundances as well as by insertion-dependent sequence bias.
a. Conditional, site-specific editing efficiencies across 3 sites within the 3xTAPE-1 or 5 sites within the 5xTAPE-1, calculated as the number of reads that contain an edit in the indicated site over the total number of reads that contain an edit in the immediately preceding site, which activates the indicated site as a target for editing. The number of all 5xTAPE-1 (or 3xTAPE-1) reads were used for calculating the site-specific editing efficiency for the Site-1, which is activated by its own key sequence. The center and error bars are mean and standard deviations, respectively, from n = 2 transfection replicates for the second plot from the left and n = 3 transfection replicates for the other 3 plots. b. Pairwise scatterplots of unigram frequencies of NNGGA insertions at the initiating monomer of 5xTAPE-1 among three transfection replicates. c. Scatterplot of unigram frequencies, averaged across three transfection replicates, at the initiating vs. second monomer of 5xTAPE-1. d. Scatterplot of averaged unigram frequencies at the initiating monomer in “pre-cloning pooling” experiment vs. the abundances of NNGGA pegRNA-expressing plasmids (left). Insertional bias was corrected for with data from a separate experiment using NNGGA pegRNA-expressing plasmids that were pooled post-cloning, resulting in a better correlation with the abundances of pegRNAs in the plasmid pool (right). Corrections were done by dividing pre-cloning unigram frequencies by post-cloning unigram frequencies at the initiating monomer and multiplying by post-cloning pegRNA plasmid frequencies. e. Scatterplot of NNGGA edit scores calculated on the initiating monomer of the 5xTAPE-1 target edited by pegRNA-expressing plasmids pooled pre-cloning vs. post-cloning. Edit scores for each insertion are calculated as log2 of the ratio between insertion frequencies and the abundances of pegRNAs in the plasmid pool. Spearman’s p was used instead of Pearson’s r. f. Scatterplot of averaged unigram frequencies at the initiating monomer in “post-cloning pooling” experiment vs. the abundances of NNGGA pegRNA-expressing plasmids (left). Correcting for insertional bias with pre-cloning unigram frequencies improves the correlation (right).

