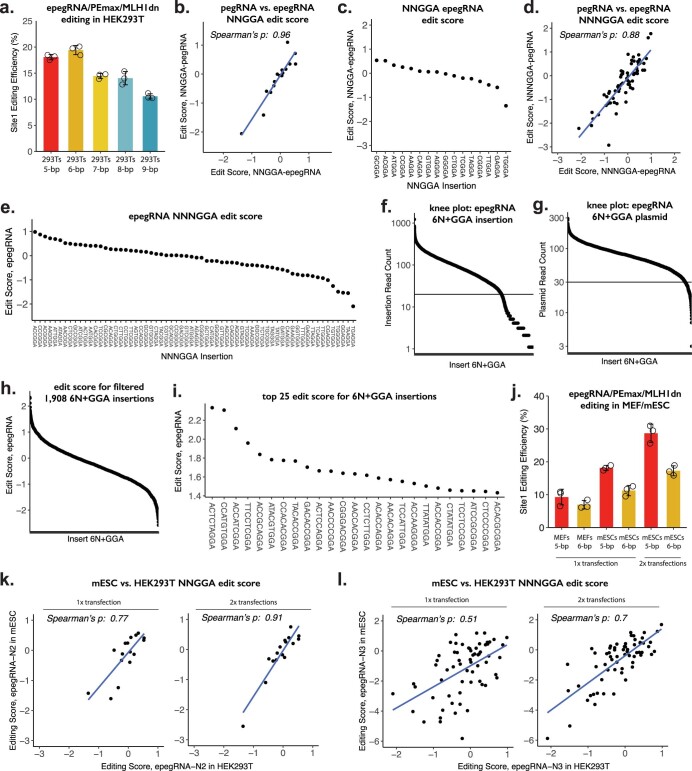
Extended Data Fig. 2. Enhancements of prime editing facilitate DNA Typewriter’s range and efficiency.
a. Editing efficiencies at the first site of 5xTAPE-1 integrated in HEK293T cells. A pool of plasmids expressing TAPE-1 targeting epegRNAs were transfected with the pCMV-PEmax-P2A-hMLH1dn plasmid. Five pools with different insertion lengths ranging from 5-bp (NNGGA) to 9-bp (NNNNNNGGA or 6N+GGA) were tested separately. The center and error bars are mean and standard deviations, respectively, from n = 3 transfection replicates. b. Scatterplot of 16 NNGGA edit scores with pegRNAs vs. epegRNAs. c. Edit scores for 16 NNGGA insertions with epegRNA. Edit scores for each insertion are calculated as log2 of the ratio between insertion frequencies and the abundances of pegRNAs in the plasmid pool. d. Scatterplot of 64 NNNGGA edit scores with pegRNAs vs. epegRNAs. e. Edit scores for 64 NNNGGA insertions with epegRNAs. f. Knee plot of read-counts for 4,096 possible 6N+GGA insertions, across three replicates. A minimum threshold of requiring at least 20 reads for a given insertion in each of the three transfection replicates was determined based on this plot. g. Knee plot of read-counts for 4,096 possible 6N+GGA-inserting pegRNAs from the pool of plasmids. A minimum threshold of 30 reads for each insertion plasmid was determined based on this plot. h. Edit scores for 1,908 6N+GGA insertions. Only insertions that appeared more than 20 reads in each of three transfection replicates and more than 30 reads in the sequencing of the plasmid pool were considered. Edit scores for each insertion are calculated as log2 of the ratio between insertion frequencies and the abundances of pegRNAs in the plasmid pool. i. Top 25 edit scores for 6N+GGA insertions. j. Editing efficiencies at the first site of 5xTAPE-1 integrated in the mouse embryonic fibroblasts (MEFs) or mouse embryonic stem cells (mESCs). For mESCs, up to two sequential transfections of a pool of epegRNA-expressing plasmids were tested. The error bars are standard deviations from n = 3 transfection replicates. k,l. Scatterplot of 16 NNGGA (k) and 64 NNNGGA (l) edit scores with epegRNAs in mESCs vs. HEK293T cells. Edit scores were calculated after one transfection (left) or two serial transfections (right) of the same pool of pCMV-PEmax-P2A-hMLH1dn/U6-epegRNA plasmids. The edit score calculated with two serial transfections showed higher correlations (Spearman’s p) with the edit score measured in HEK293Ts, probably due to better coverage of the insertion pools. Edit scores shown in this figure are calculated by combining sequencing data across n = 3 transfection replicate experiments.

