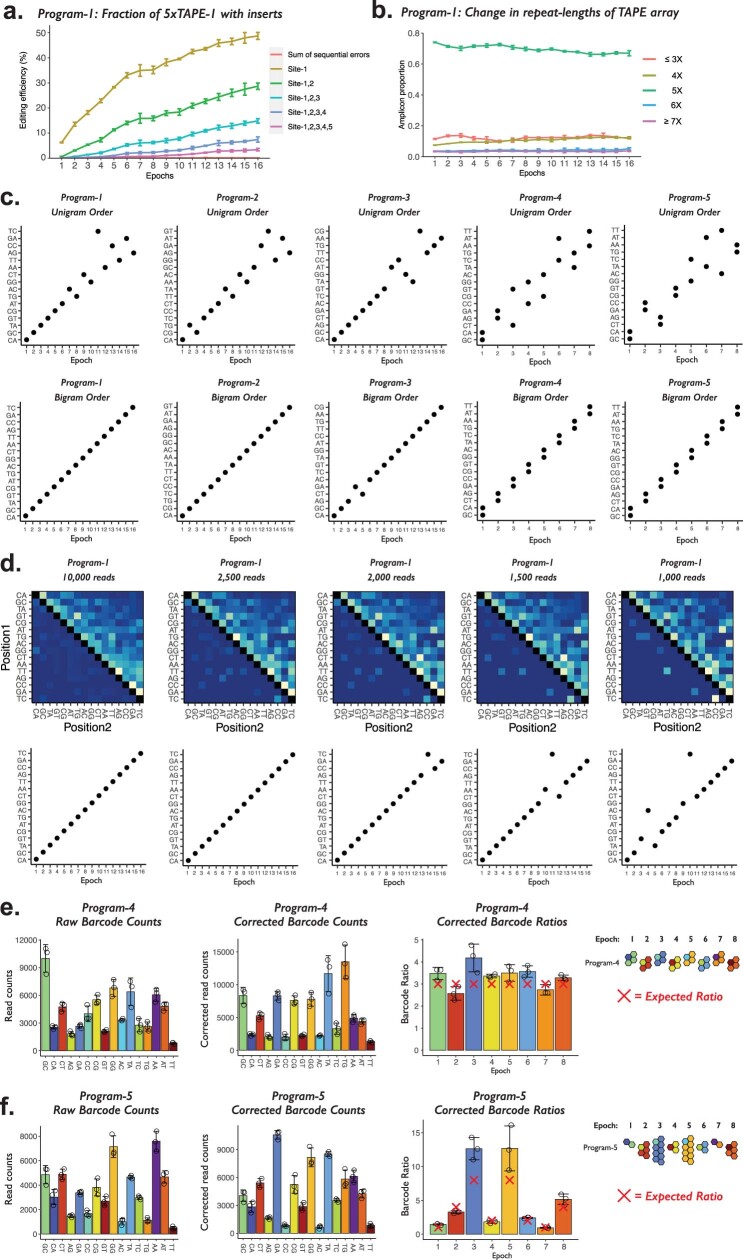
Extended Data Fig. 4. Inferred event order and magnitude from sequential transfections.
a. Sequential editing efficiency and sum of sequential errors from five sites in 5xTAPE-1 across 16 transfection epochs of Program-1. b. Repeat-length change of 5xTAPE-1 array sampled over 16 transfection epochs. c. For each of the five transfection programs, the event orders are inferred using “Unigram” (top) and “Bigram” (bottom) information. d. Undersampling analysis of Program-1. From the original 277,397 sequencing reads used for Program-1, we undersampled to 10,000, 2,500, 2,000, 1,500, or 1,000 reads. For each sampling point, the bigram transition matrix (top) was plotted and order of events (bottom) were inferred using bigram information. In c,d, sequencing reads from n = 3 independent transfection experiments are combined. e,f. For Program-4 (e) and Program-5 (f), the absolute barcode read counts (left) are corrected based on the edit score of 16 NNGGA barcodes (middle), and used to calculate the relative magnitude of two co-transfected barcodes (right). The expected barcode ratios are marked with a red “X” mark in each epoch. The center and error bars in panels (a), (b), (e), and (f) are mean and standard deviations, respectively, from n = 3 transfection replicates.

