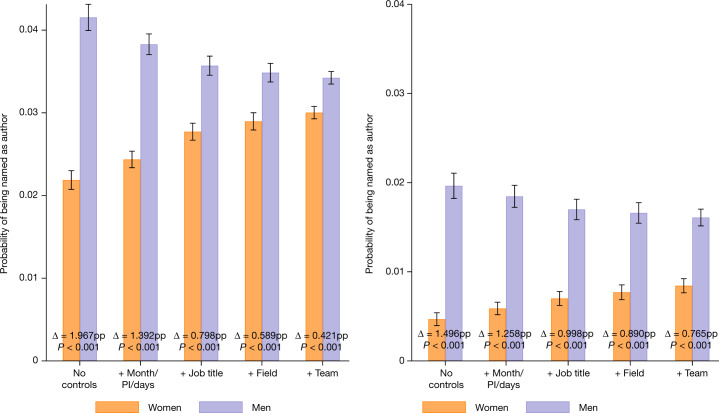
Fig. 2. Women are still less likely to be named even when controls are included.
Graphs show the probability that an individual in a team is an author on a given article (left) or patent (right) published by that team. Left, the likelihood of attribution on an article is estimated from 17,929,271 potential authorship observations. Right, the likelihood of attribution on a patent is estimated from 3,203,831 inventorship observations. The data associated with each bar are generated by predicting the dependent variable from ordinary least squares regressions of the likelihood of being named on gender and the indicated controls (reported in Extended Data Table 4). For the purpose of plotting probabilities and gender differences holding all else fixed (Δ), we hold all of the controls at their respective means. Because men have higher values than women on average on the controlled factors that increase the probability of attribution, the predicted probabilities for men decline and those for women increase as more controls are included. Controls, from left to right: (1) none; (2) whether a potential author is the PI of the team, the number of days worked on the team and publication date (calendar year × month); (3) job title of the potential author/inventor; (4) research field of the team; (5) individual indicator variables for each team (these team indicators subsume the fields indicator). The observations are weighted by the inverse of the number of teams per employee times the inverse of the number of potential articles or patents per employee. Individual data on the probability of women or men being named on articles or patents are visualized in Supplementary Fig. 6. Error bars are centred on the mean and extend to the 95% confidence interval based on 1.96 × s.e. Standard errors are clustered by team and employee.

