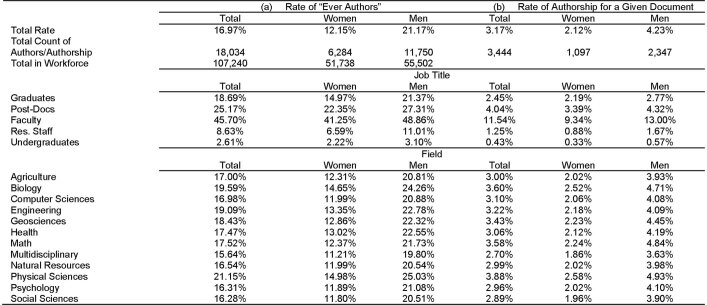
Extended Data Table 2.
Attribution Rates by Job Title and Field
With the exception of two rows, “Total Count of Authors/Authorship” and “Total in Workforce”, the first three columns (a) summarize the share of “ever authors on a paper or ever inventors on a patent”. The numerator is individuals in each category who are ever named as an author on a publication or a patent. The denominator is the total number of individuals in that category. None of the total counts includes individuals whose gender could not be imputed. The second three columns (b) summarize the share of authorships: The denominator – the set of “potential authorships” – was created by associating all members of each team who were employed one year prior to the publication/application date of all associated articles/patents emanating from that team during the analysis period. Since some individuals, such as research staff, are on multiple teams, they are proportionately allocated across teams and papers using a set of analytical weights (see Methods Analytical Sample section for details). The numerator - attribution - was defined as “actual authorships” on those publications and patents (see Methods: Analytical Sample for details). The “Total Count of Authors/Authorship” row summarizes the total counts of “ever authors” in the first three columns (a) and the weighted total counts of actual authorships in the second three columns (b). The “Total in Workforce” row summarizes the total counts of individuals in our sample. Note that the “Total” column excludes those in our sample who we could not identify as either men or women.

