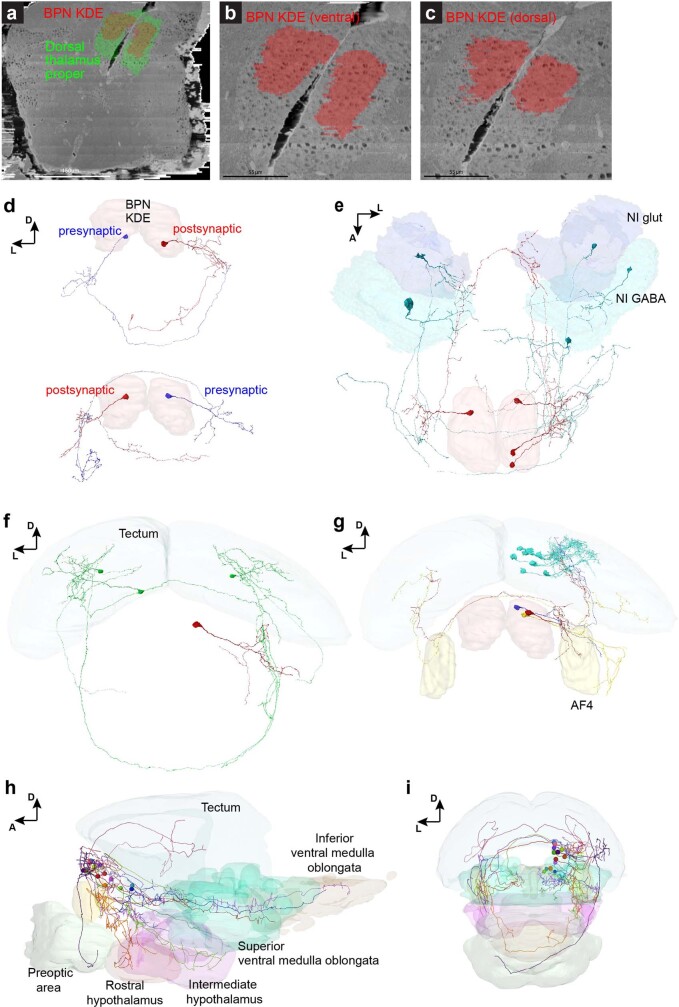
Extended Data Fig. 6. Representative example neurons and brain areas in the EM dataset.
a-c, Registration of mapzebrain regions to the EM dataset. Shown are top-views of the kernel density estimation for bout-preference neurons (red) inside the dorsal thalamus proper (green, a) and at different coronal planes (b, c). N = 1 EM stack. d, Frontal views of the BPN KDE in EM reconstructions showing two examples (top and bottom) for synaptically connected putative BPN partners across brain hemispheres. e, Dorsal view of three putative BPNs (red) and their presynaptic partners in the nucleus isthmi (glutamatergic and GABAergic domains are annotated). f, A single putative BPN (red) receives ipsi- and contralateral synaptic input from at least three identified tectal PVPNs (green). g, Three examples for putative BPNs (red, orange, purple) with axonal projections to the ipsi- and contralateral tectum. Eight tectal PVINs (cyan), which are postsynaptic to the red putative BPN are shown. h-i, Mapzebrain atlas showing single cells in the BPN KDE and their targeted brain regions in lateral (h) and frontal (i) views. AF4 (yellow) is shown as a reference. Scale bars: a, 150 µm; b, c, 55 µm.

