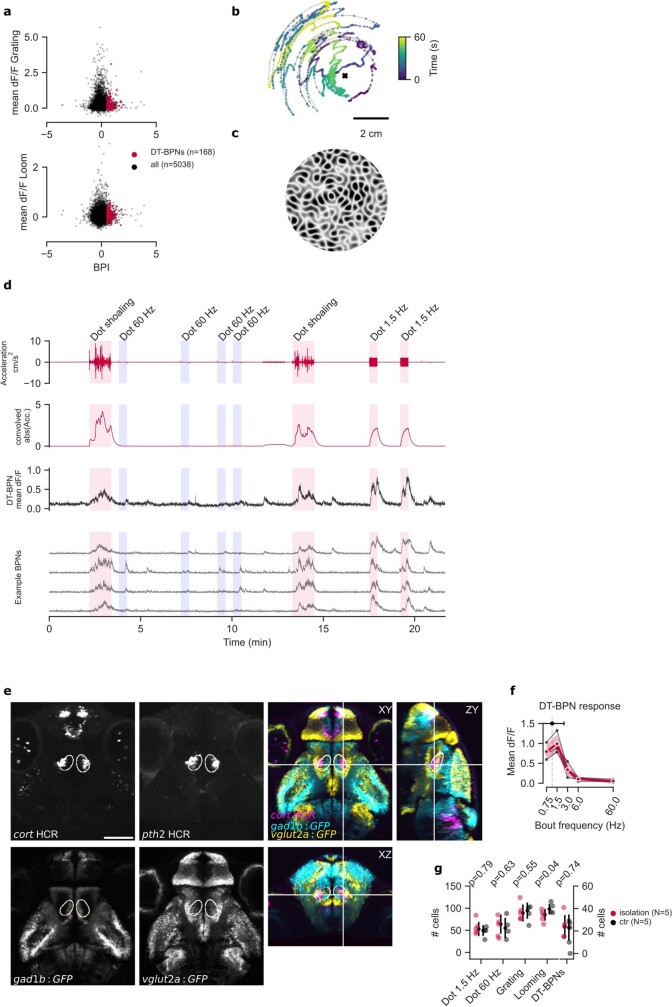
Extended Data Fig. 5. BPN response specificity in juvenile and larval animals.
a, Responses of DT-BPNs (n = 56 ± 51) and all other recorded neurons above threshold (n = 1679 ± 1065) to looming and translational grating stimuli from 3 animals where these stimuli were included in the protocol. DT-BPNs are not strongly activated by either of the two control stimuli. b, Dot shoaling stimulus. Dot position recapitulates the location of a conspecific relative to a focal fish facing up. Cross marks location of the focal fish. c, Whole-field motion stimulus used in Fig. 2i. d, DT-BPNs respond to dot shoaling stimulus. Top red trace shows instantaneous dot stimulus acceleration, bottom red trace the same time series convolved with GCaMP6s kernel (see methods). Dot shoaling, 1.5 Hz and 60 Hz stimuli were shown in pseudo-random order as indicated. Median trace represents n = 84 DT-BPNs from one fish, including four representative neurons shown below. e, Expression of cort, pth2, gad1b and vglut2a defines the location of the larval BPN KDE as dorsal thalamus. gad1b positive ‘stripe’ of cells near the midline marks the dorsal edge of VT. Left four panels show single planes. Right shows merged orthogonal views. Each channel shows mean expression over multiple individual fish registered to the mapzebrain atlas. cort and pth2 are HCR labels, mean of N = 3 animals each. gad1b and vglut2a are Gal4 enhancer trap lines driving expression of GFP, N = 5 animals each. Also see Video S1. f, Larval DT-BPN (n = 51 ± 14 neurons per fish, N = 4 animals) tuning curve to stimulus frequencies from 0.75 to 60 Hz shown in red. Mean tuning peak of individual neurons (shown above) was 1.1 Hz ± 1.3 Hz. Black lines represent means of individual animals. Data from a subset of all animals in Fig. 2j with number of recorded DT-BPNs > 30. g, Number of neurons in DT responding to different visual stimuli of larvae raised in social isolation compared to group-raised larvae (N = 5 animals per group). Number of responsive neurons to bout-like motion as well as the number of DT-BPNs are not significantly different in socially isolated animals. Error bars: 1SD. P-value: two-tailed student’s t-test, no corrections. Scale bars: b, 2 cm; e, 100 µm.

