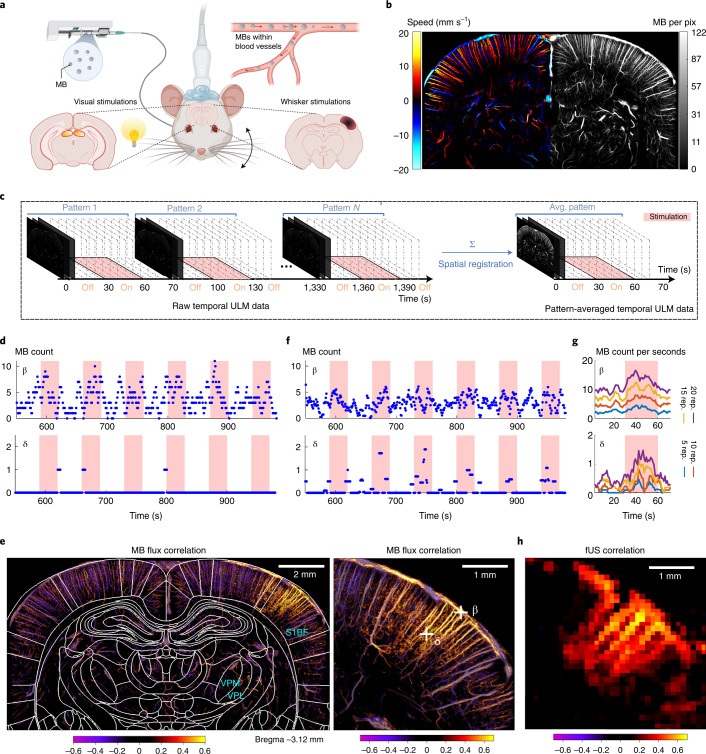
Fig. 1. Functional ULM reveals brain-wide hyperemia at a microscopic scale during brain activation.
a, Schematic of the experimental setup for ULM brain imaging through a coronal plane during whisker or visual stimulations in an anesthetized rat receiving a continuous intravenous injection of MBs. b, Blood velocity (left) and MB count ULM maps (right) of the rat brain vasculature at 6.5-μm resolution (n = 7 experiments). c, Temporal rasterization scheme to create dynamic ULM data. d, Time courses of MB count for a pixel in a large (pial vessel, β) and smaller blood vessel (first-order branching after descending arteriole, δ), illustrated in g. e, Pearson correlation coefficient computed between stimulation pattern and MB flux signal, in the whole-brain slice imaged (left) and zoomed in the activated barrel cortex (right). The map is overlaid with rat brain atlas52 at Bregma = −3.12 mm; n = 4 experiments. VPL, ventro-postero-lateral thalamic nuclei. f, Time courses of MB count for the same pixels after spatial registration. g, Time courses of MB flux for the same pixels after pattern summation and division by window length. The time courses are given for an increasing number of pattern repetitions. h, Functional correlation map as obtained in e, but using conventional fUS imaging (ultrafast Doppler imaging without any MB injection), n = 4 experiments.

