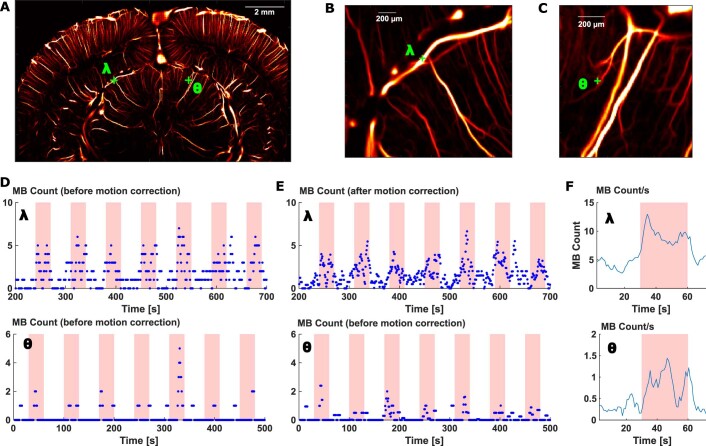
Extended Data Fig. 6. Temporal profile of the MB flow in pixels from deep-seated vessels of the superior colliculus during visual stimulation.
(A) Location of pixels λ (in a 60 μm diameter vessel) and θ (in a 15 μm diameter vessel) in the superior colliculus. (B-C) Zoomed regions of interest from image (A). (D-E) Temporal profile of MB count in pixels λ and θ before and after motion correction during the successive visual stimuli. (F) Temporal profile of MB count in pixels λ and θ after pattern summation. (A-F) N = 3 experiments.

