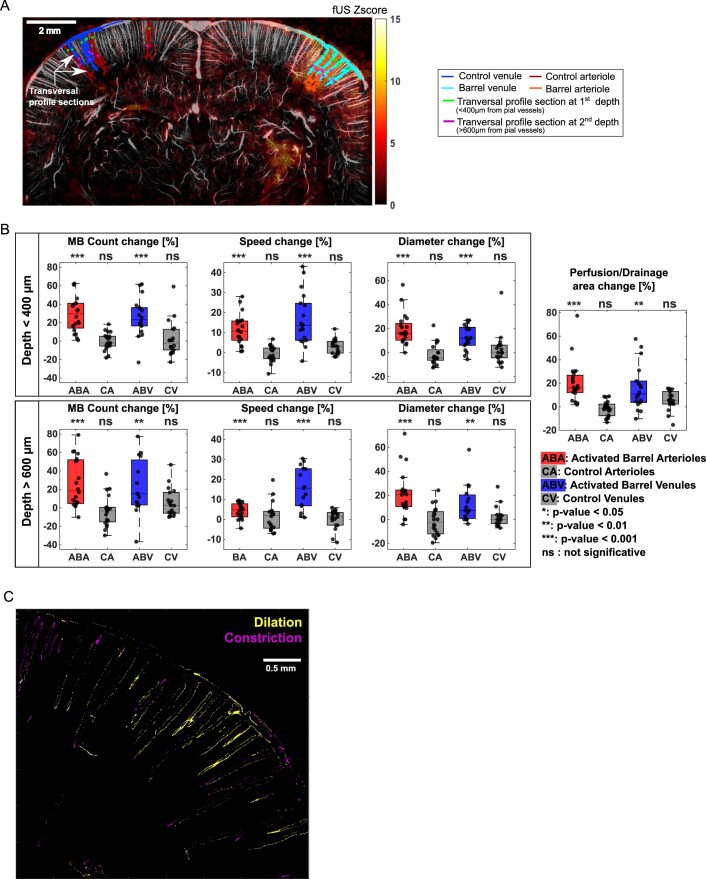
Extended Data Fig. 7. Detailed statistical analysis of fULM signals in selected vessels during whisker stimulations.
(A) Illustration of the selection of activated barrel and contralateral cortex blood vessels (arterioles and venules in the activated barrel cortex and contralateral cortex for controls). Profiles were measured at two depths: <400 μm (green marks) and >600 μm (magenta marks) from pial vessels. (B) Boxplots corresponding to rest value and variation relative to rest (mean ± SE), p-value for two-sided Wilcoxon signed rank test on this variation (null hypothesis: distribution with median equal to zero) for MB Count, speed, diameter and perfusion for the different categories of blood vessels. The number of animals for depth 1 are N = 20 (ABA and CA) and N = 18 (ABV and CV). The number of animals for depth 2 are N = 20 (ABA and CA), N = 18 (CV), N = 15 (ABV). The number of animals for perfusion and drainage area measurements are N = 20 (ABA and CA) and N = 18 (ABV and CV). The central mark indicates the median, and the bottom and top edges of the box indicate the 25th and 75th percentiles, respectively. The whiskers extend to the most extreme data points not considered outliers. Scatter plots of the data used for the boxplot are overlaid on each boxplot. All results of the Wilcoxon test are detailed in Supplementary Table 1 and summarized on top of each boxplot. (C) Dilatation and Constriction map. (A-C) N = 4 experiments.

