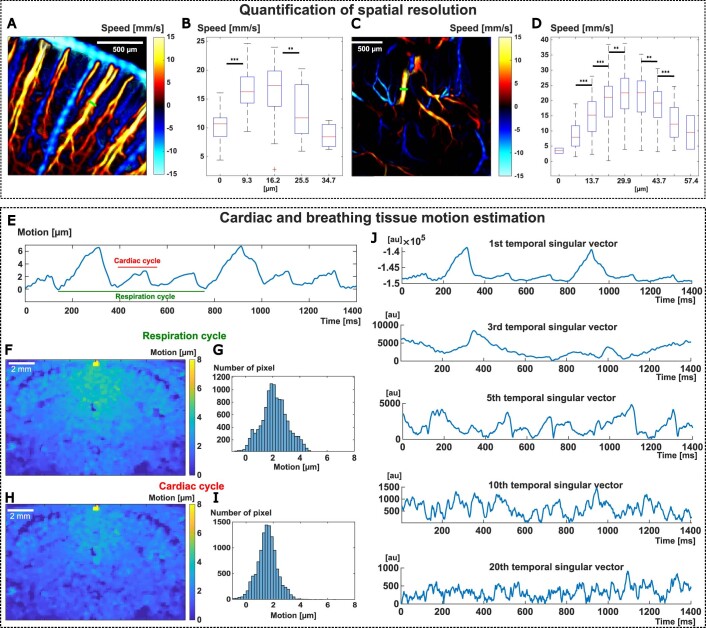
Extended Data Fig. 10. Quantification of fULM spatial resolution, cardiac and respiratory motion.
(A-C) Quantification of the spatial resolution. Signed velocity map of the rat brain vasculature showing two vessels profiles (green) chosen for the quantification in the cortex (A-B) and deep thalamic region (C-D). (B-D) Velocity profiles for each profile displayed in (A-C). Bubbles velocities from one time point of the pattern-averaged data are gathered in bins corresponding to each [6.875 6.25] μm2 pixel. The central mark of the boxplot indicates the median, and the bottom and top edges of the box indicate the 25th and 75th percentiles, respectively. The p-values for the a two-sampled t-test between each consecutive bin are indicated as: *P < 0.05,**P < 0.01, ***P < 0.001. Samples number for each bin from left to right: (B): [11, 27,26,17,3]. (D) [2, 47,96,179,223,194,135, 50, 2]. (E-J) Estimation of cardiac and breathing tissue motion. (E) Spatially averaged tissue motion along the z-axis exhibits cardiac and breathing pulsatility (respiration cycle: ~620 ms / ~97bpm; cardiac cycle: ~180 ms / ~330bpm). (F-G) Mean tissue motion over a respiratory cycle evaluated in each pixel represented in a map (B) and in a histogram (C). (H-I) Mean tissue motion over a cardiac cycle evaluated in each pixel represented in a map (D) and in a histogram (E). (J) Temporal singular vector (i = 1,3,5,10,20) multiplied by each respective singular value of the singular value decomposition of the same raw IQ data used in (E). (E-J) N = 4 experiments.

